emod_api.demographics.Demographics module
- emod_api.demographics.Demographics.from_template_node(lat=0, lon=0, pop=1000000, name='Erewhon', forced_id=1)[source]
Create a single-node Demographics instance from a few params.
- emod_api.demographics.Demographics.from_file(base_file)[source]
Create a Demographics instance from an existing demographics file.
- emod_api.demographics.Demographics.get_node_ids_from_file(demographics_file)[source]
Get a list of node ids from a demographics file.
- emod_api.demographics.Demographics.get_node_pops_from_params(tot_pop, num_nodes, frac_rural)[source]
Get a list of node populations from the params used to create a sparsely parameterized multi-node Demographics instance.
- emod_api.demographics.Demographics.from_params(tot_pop=1000000, num_nodes=100, frac_rural=0.3, id_ref='from_params', random_2d_grid=False)[source]
Create an EMOD-compatible Demographics object with the population and numbe of nodes specified.
- Parameters
tot_pop – The total population.
num_nodes – Number of nodes. Can be defined as a two-dimensional grid of nodes [longitude, latitude]. The distance to the next neighbouring node is 1.
frac_rural – Determines what fraction of the population gets put in the ‘rural’ nodes, which means all nodes besides node 1. Node 1 is the ‘urban’ node.
id_ref – Facility name
random_2d_grid – Create a random distanced grid with num_nodes nodes.
- Returns
Object of type Demographics
- emod_api.demographics.Demographics.from_csv(input_file, res=0.008333333333333333, id_ref='from_csv')[source]
Create an EMOD-compatible Demographics instance from a csv population-by-node file.
- emod_api.demographics.Demographics.from_pop_csv(pop_filename_in, pop_filename_out='spatial_gridded_pop_dir', site='No_Site')[source]
- class emod_api.demographics.Demographics.Demographics(nodes, idref='Gridded world grump2.5arcmin', base_file=None)[source]
Bases:
emod_api.demographics.BaseInputFile.BaseInputFileThis class is a container of data necessary to produce a EMOD-valid demographics input file. It can be initialized from an existing valid demographics.joson type file or from an array of valid Nodes.
- apply_overlay(overlay_nodes: list)[source]
- Parameters
overlay_nodes – Overlay list of nodes over existing nodes in demographics
- Returns
- generate_file(name='demographics.json')[source]
Write the contents of the instance to an EMOD-compatible (JSON) file.
- send(write_to_this, return_from_forked_sender=False)[source]
Write data to a file descriptor as specified by the caller. It must be a pipe, a filename, or a file ‘handle’
- Parameters
write_to_this – File pointer, file path, or file handle.
return_from_forked_sender – Defaults to False. Only applies to pipes. Set to true if caller will handle exiting of fork.
Example:
1) Send over named pipe client code
# Named pipe solution 1, uses os.open, not open.
import tempfile
tmpfile = tempfile.NamedTemporaryFile().name
os.mkfifo( tmpfile )

fifo_reader = os.open( tmpfile, os.O_RDONLY |  os.O_NONBLOCK )
fifo_writer = os.open( tmpfile, os.O_WRONLY |  os.O_NONBLOCK )
demog.send( fifo_writer )
os.close( fifo_writer )
data = os.read( fifo_reader, int(1e6) )

2) Send over named pipe client code version 2 (forking)
import tempfile
tmpfile = tempfile.NamedTemporaryFile().name
os.mkfifo( tmpfile )

process_id = os.fork()
# parent stays here, child is the sender
if process_id:
    # reader
    fifo_reader = open( tmpfile, "r" )
    data = fifo_reader.read()
    fifo_reader.close()
else:
    # writer
    demog.send( tmpfile )

3) Send over file.
import tempfile
tmpfile = tempfile.NamedTemporaryFile().name
# We create the file handle and we pass it to the other module which writes to it.
with open( tmpfile, "w" ) as ipc:
    demog.send( ipc )

# Assuming the above worked, we read the file from disk.
with open( tmpfile, "r" ) as ipc:
    read_data = ipc.read()

os.remove( tmpfile )
- Returns
N/A
- property node_ids
Return the list of (geographic) node ids.
- property nodes
- property node_count
Return the number of (geographic) nodes.
- get_node(nodeid)[source]
Return the node idendified by nodeid. Search either name or actual id :param nodeid: :return:
- SetMigrationPattern(pattern: str = 'rwd')[source]
Set migration pattern. Migration is enabled implicitly. It’s unusual for the user to need to set this directly; normally used by emodpy.
- Parameters
pattern – Possible values are “rwd” for Random Walk Diffusion and “srt” for Single Round Trips.
- SetRoundTripMigration(gravity_factor, probability_of_return=1.0, id_ref='short term commuting migration')[source]
Set commuter/seasonal/temporary/round-trip migration rates. You can use the x_Local_Migration configuration parameter to tune/calibrate.
- Parameters
gravity_factor – ‘Big G’ in gravity equation. Combines with 1, 1, and -2 as the other exponents.
probability_of_return – Likelihood that an individual who ‘commuter migrates’ will return to the node of origin during the next migration (not timestep). Defaults to 1.0. Aka, travel, shed, return.”
id_ref – Text string that appears in the migration file itself; needs to match corresponding demographics file.
- SetOneWayMigration(rates_path, id_ref='long term migration')[source]
Set one way migration. You can use the x_Regional_Migration configuration parameter to tune/calibrate.
- Parameters
rates_path – Path to csv file with node-to-node migration rates. Format is: source (node id),destination (node id),rate.
id_ref – Text string that appears in the migration file itself; needs to match corresponding demographics file.
- SetSimpleVitalDynamics(crude_birth_rate=<emod_api.demographics.DemographicsTemplates.CrudeRate object>, crude_death_rate=<emod_api.demographics.DemographicsTemplates.CrudeRate object>, node_ids=None)[source]
Set fertility, mortality, and initial age with single birth rate and single mortality rate.
- Parameters
crude_birth_rate – Birth rate, per year per kiloperson.
crude_death_rate – Mortality rate, per year per kiloperson.
node_ids – Optional list of nodes to limit these settings to.
- SetEquilibriumVitalDynamics(crude_birth_rate=<emod_api.demographics.DemographicsTemplates.CrudeRate object>, node_ids=None)[source]
Set fertility, mortality, and initial age with single rate and mortality to achieve steady state population.
- Parameters
crude_birth_rate – Birth rate. And mortality rate.
node_ids – Optional list of nodes to limit these settings to.
- SetEquilibriumVitalDynamicsFromWorldBank(wb_births_df, country, year, node_ids=None)[source]
Set steady-state fertility, mortality, and initial age with rates from world bank, for given country and year.
- Parameters
wb_births_df – Pandas dataframe with World Bank birth rate by country and year.
country – Country to pick from World Bank dataset.
year – Year to pick from World Bank dataset.
node_ids – Optional list of nodes to limit these settings to.
- SetIndividualAttributesWithFertMort(crude_birth_rate=<emod_api.demographics.DemographicsTemplates.CrudeRate object>, crude_mort_rate=<emod_api.demographics.DemographicsTemplates.CrudeRate object>)[source]
- AddIndividualPropertyAndHINT(Property: str, Values: List[str], InitialDistribution: Optional[List[float]] = None, TransmissionMatrix: Optional[List[List[float]]] = None, Transitions: Optional[List] = None)[source]
Add Individual Properties, including an optional HINT configuration matrix.
- Parameters
Property – property (if property already exists an exception is raised).
Values – property values.
InitialDistribution – initial distribution.
TransmissionMatrix – transmission matrix.
- Returns
N/A/
- AddAgeDependentTransmission(Age_Bin_Edges_In_Years=[0, 1, 2, - 1], TransmissionMatrix=[[1.0, 1.0, 1.0], [1.0, 1.0, 1.0], [1.0, 1.0, 1.0]])[source]
Set up age-based HINT. Since ages are a first class property of an agent, Age_Bin is a special case of HINT. We don’t specify a distribution, but we do specify the age bin edges, in units of years. So if Age_Bin_Edges_In_Years = [ 0, 10, 65, -1 ] it means you’ll have 3 age buckets: 0-10, 10-65, & 65+. Always ‘book-end’ with 0 and -1.
- Parameters
Age_Bin_Edges_In_Years – array (or list) of floating point values, representing the age bucket bounderies.
TransmissionMatrix – 2-D array of floating point values, representing epi connectedness of the age buckets.
- SetDefaultIndividualAttributes()[source]
NOTE: This is very Measles-ish. We might want to move into MeaslesDemographics
- SetBirthRate(birth_rate, node_ids=None)[source]
Set Default birth rate to birth_rate. Turn on Vital Dynamics and Births implicitly.
- SetMortalityRate(mortality_rate: emod_api.demographics.DemographicsTemplates.CrudeRate, node_ids: Optional[List[int]] = None)[source]
Set constant mortality rate to mort_rate. Turn on Enable_Natural_Mortality implicitly.
- SetMortalityDistribution(distribution: Optional[emod_api.demographics.PropertiesAndAttributes.IndividualAttributes.MortalityDistribution] = None, node_ids: Optional[List[int]] = None)[source]
Set a default mortality distribution for all nodes or per node. Turn on Enable_Natural_Mortality implicitly.
- Parameters
distribution – distribution
node_ids – a list of node_ids
- Returns
None
- SetMortalityOverTimeFromData(data_csv, base_year, node_ids=[])[source]
Set default mortality rates for all nodes or per node. Turn on mortality configs implicitly. You can use the x_Other_Mortality configuration parameter to tune/calibrate.
- Parameters
data_csv – Path to csv file with the mortality rates by calendar year and age bucket.
base_year – The calendar year the sim is treating as the base.
node_ids – Optional list of node ids to apply this to. Defaults to all.
- Returns
None
- SetAgeDistribution(distribution: emod_api.demographics.PropertiesAndAttributes.IndividualAttributes.AgeDistribution, node_ids: Optional[List[int]] = None)[source]
Set a default age distribution for all nodes or per node. Sets distribution type to COMPLEX implicitly. :param distribution: age distribution :param node_ids: a list of node_ids
- Returns
None
- SetDefaultNodeAttributes(birth=True)[source]
Set the default NodeAttributes (Altitude, Airport, Region, Seaport), optionally including birth, which is most important actually.
- SetDefaultProperties()[source]
Set a bunch of defaults (age structure, initial susceptibility and initial prevalencec) to sensible values.
- SetDefaultPropertiesFertMort(crude_birth_rate=<emod_api.demographics.DemographicsTemplates.CrudeRate object>, crude_mort_rate=<emod_api.demographics.DemographicsTemplates.CrudeRate object>)[source]
Set a bunch of defaults (birth rates, death rates, age structure, initial susceptibility and initial prevalencec) to sensible values.
- SetDefaultFromTemplate(template, setter_fn=None)[source]
Add to the default IndividualAttributes using the input template (raw json) and set corresponding config values per the setter_fn. The template should always be constructed by a function in DemographicsTemplates. Eventually this function will be hidden and only accessed via separate application-specific API functions such as the ones below.
- SetNodeDefaultFromTemplate(template, setter_fn)[source]
Add to the default NodeAttributes using the input template (raw json) and set corresponding config values per the setter_fn. The template should always be constructed by a function in DemographicsTemplates. Eventually this function will be hidden and only accessed via separate application-specific API functions such as the ones below.
- SetEquilibriumAgeDistFromBirthAndMortRates(CrudeBirthRate=<emod_api.demographics.DemographicsTemplates.CrudeRate object>, CrudeMortRate=<emod_api.demographics.DemographicsTemplates.CrudeRate object>, node_ids=None)[source]
Set the inital ages of the population to a sensible equilibrium profile based on the specified input birth and death rates. Note this does not set the fertility and mortality rates.
- SetInitialAgeExponential(rate=0.0001068, description='')[source]
Set the initial age of the population to an exponential distribution with a specified rate. :param rate: rate :param description: description, why was this distribution chosen
- SetInitialAgeLikeSubSaharanAfrica(description='')[source]
Set the initial age of the population to a overly simplified structure that sort of looks like sub-Saharan Africa. This uses the SetInitialAgeExponential. :param description: description, why was this age chosen?
- SetOverdispersion(new_overdispersion_value, nodes=[])[source]
Set the overdispersion value for the specified nodes (all if empty).
- SetConstantSusceptibility()[source]
Set the initial susceptibilty for each new individual to a constant value of 1.0.
- SetInitPrevFromUniformDraw(min_init_prev, max_init_prev, description='')[source]
Set Initial Prevalence (one value per node) drawn from an uniform distribution. :param min_init_prev: minimal initial prevalence :param max_init_prevalence: maximal initial prevalence :param description: description, why were these parameters chosen?
- SetConstantRisk(risk=1, description='')[source]
Set the initial risk for each new individual to the same value, defaults to full risk :param risk: risk :param description: description, why was this parameter chosen?
- SetHeteroRiskUniformDist(min_risk=0, max_risk=1)[source]
Set the initial risk for each new individual to a value drawn from a uniform distribution.
- SetHeteroRiskLognormalDist(mean=1.0, sigma=0)[source]
Set the initial risk for each new individual to a value drawn from a log-normal distribution.
- SetHeteroRiskExponDist(mean=1.0)[source]
Set the initial risk for each new individual to a value drawn from an exponential distribution.
- SetFertilityOverTimeFromParams(years_region1, years_region2, start_rate, inflection_rate, end_rate, node_ids=[])[source]
Set fertility rates that vary over time based on a model with two linear regions. Note that fertility rates use GFR units: babies born per 1000 women of child-bearing age annually. You can use the x_Birth configuration parameter to tune/calibrate.
Refer to the following diagram.
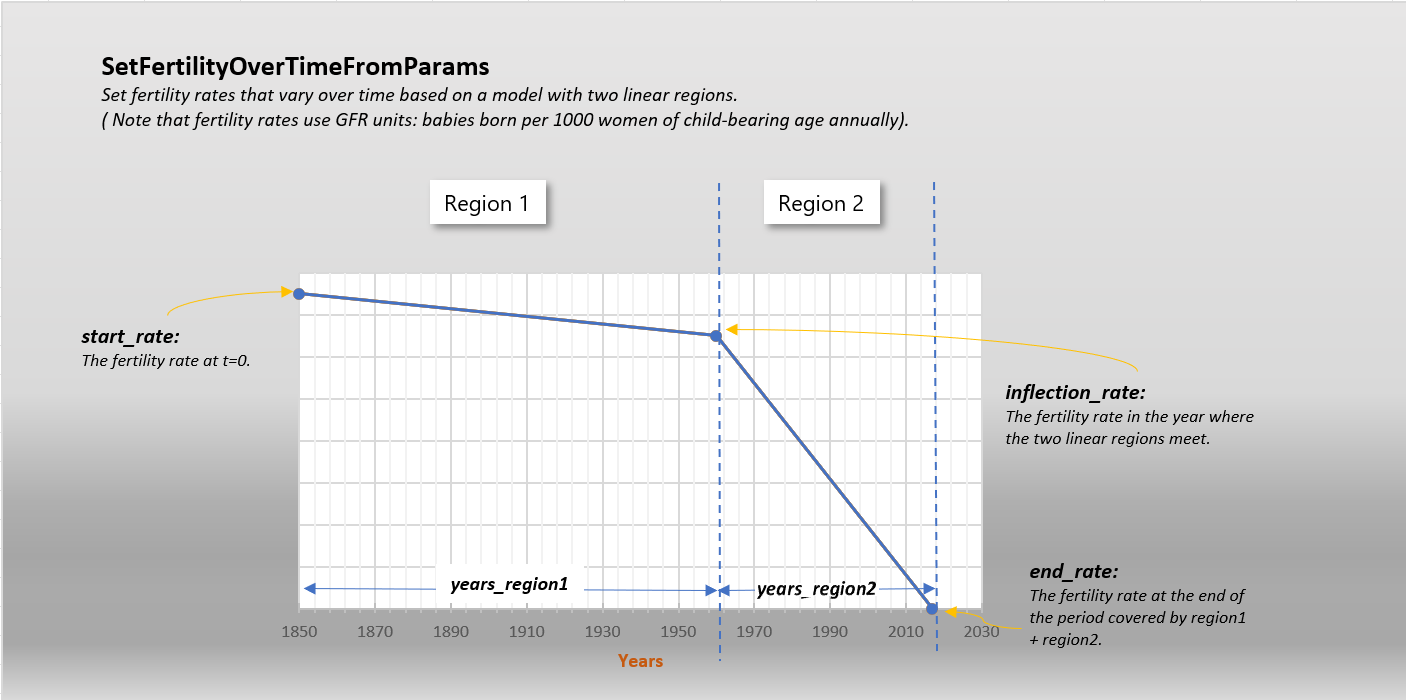
- Parameters
years_region1 – The number of years covered by the first linear region. So if this represents 1850 to 1960, years_region1 would be 110.
years_region2 – The number of years covered by the second linear region. So if this represents 1960 to 2020, years_region2 would be 60.
start_rate – The fertility rate at t=0.
inflection_rate – The fertility rate in the year where the two linear regions meet.
end_rate – The fertility rate at the end of the period covered by region1 + region2.
node_ids – Optional list of node ids to apply this to. Defaults to all.
- Returns
rates array (Just in case user wants to do something with them like inspect or plot.)
- infer_natural_mortality(file_male, file_female, interval_fit=[1970, 1980], which_point='mid', predict_horizon=2050, csv_out=False, n=0, results_scale_factor=0.0027397260273972603)[source]
Calculate and set the expected natural mortality by age, sex, and year from data, predicting what it would have been without disease (usually HIV).