Run regression tests
The Python script regression_test.py runs a suite of regression simulations and compares the output to the reference output for each simulation. It is set up to run the simulations on an HPC cluster; however, you can run modify the script to run tests locally. However, the script was written with remote execution in mind and running it locally can be time-consuming. Running the entire regression suite locally will take several hours on average.
The regression scenarios, script, configuration file, and other relevant files are all in the Regression directory. Be aware that many of these tests, due to abnormally high or low values, will produce output that should not be considered scientifically accurate.
Modify the configuration file, regression_test.cfg, for your environment, setting the values for the location of the working directory, input files, binary file, and cluster settings.
For local Windows simulations, set the values under [WINDOWS].
For local CentOS simulations, set the values under [POSIX]. Note that CentOS simulations are run locally by default and cannot be commissioned to an HPC cluster.
For simulations on IDM HPC clusters, no changes are necessary if your username and password are cached locally.
For simulations on your own HPC cluster, create [HPC-<cluster>] and [ENVIRONMENT-<cluster>] sections for your cluster that contain the same variables as shown for IDM HPC clusters.
Select the suite of regression tests you want to run. This is indicated by a JSON file in the following format:
{
    "tests": [{
        "path": "Relative path to test directory."
    }, {
        "path": "Relative path to test directory."
    }]
}
You can use one of the JSON files in the Regression directory or create your own. The sanity.json file is recommended for quickly testing a wide range of EMOD functionality.
From the Regression directory, open a Command Prompt window and run the regression test script, regression_test.py. It requires the name of the regression suite (without the .json extension) and the relative path to Eradication.exe. For example:
regression_test.py sanity ..\Eradication\x64\Release\Eradication.exe
In addition, you may need to include the following optional arguments depending on your testing environment or how Eradication.exe was built.
Argument
Default
Description
--perfFalse
Measure Eradication.exe performance.
--hidegraphsFalse
Suppress pop-up graphs in case of validation failures.
--debugFalse
Use the debug path for EMODules.
--labelAdd a custom suffix for HPC job name.
--configregression_test.cfg
The regression test configuration file.
--disable-schema-testTrue
Include to suppress schema testing, which is on by default.
--use-dllsFalse
Use EMODules when running tests.
--all-outputsFalse
Use all output JSON files for validation, not just InsetChart.json.
--dll-pathThe path to the root directory of the EMODules to use.
--skip-emodule-checkFalse
Skip checking if EMODules on the cluster are up-to-date, which can be slow.
--sconsFalse
Indicate that this is a SCons build so custom DLLs are found in the build/64/Release directory.
--localFalse
Run all simulations locally.
Review the output and examine any failures.
EMOD will output the standard error and logging files, StdErr.txt and StdOut.txt, produced from any simulation (see Error and logging files). In addition, regression_test.py will output time.txt under the regression test working directory and report_xxxx.xml under Regression/reports. The time report contains the EMOD version and total run time of the simulation. The regression report is in JUnit standard form and captures run information, including pass/fail/complete and time to complete.
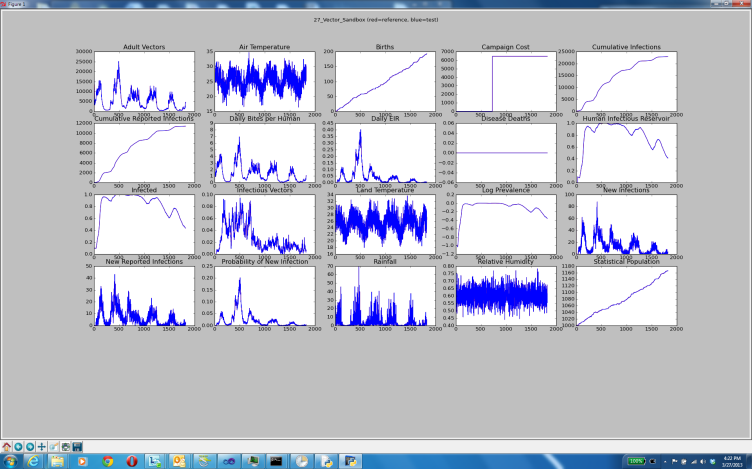
If a simulation completes saying the run passed but the channel order was different than the reference output, this is considered a pass. However, if any output completes but does not match the reference output, this is considered a failure and a matplotlib chart of the output will appear in a pop-up window. The chart will appear immediately after the simulation, before the entire suite of regression tests completes. You can manipulate the output of the charts, such as adjusting the scale of the plots, zooming or panning, and so forth, through the icons at the bottom of the chart window.
If any of the regression tests fail and you have not made any changes to the EMOD source code, email support@idmod.org.