Population density and transmission scaling
Disease transmission depends on the rate effective contacts as represented by parameter
Frequency-dependent scaling
By default, EMOD uses frequency-dependent transmission and the overall transmissibility does not change with population size or density. An infected individual will infect the same number of people either in a small village or in a metropolitan area. For this case,
so that the transmission rate inversely proportional to
Density-dependent scaling
However, when population size is low it’s possible that the transmissibility might be
lower and follow density-dependent behavior. Think of a room containing
Usually, the denominator is taken as
Saturating function of population density
Based on existing evidence, it is possible that neither a frequency-dependent nor a density- dependent mechanism may adequately describe the correct scaling over the entire population density spectrum, but that more closely follows a non-linear scaling function. That is, contact rates tend to increase with density but saturate at high densities. EMOD allows the transmission rate to scale as a saturating function of population density. The force of infection contributed by each infected individual under these two cases of transmission scaling are as follows:
Here,
where
The saturating function of density is enabled by setting the EMOD configuration parameter
Population_Density_Infectivity_Correction to SATURATING_FUNCTION_OF_DENSITY.
Finally, the
This described in more detail in the article The scaling of contact rates with population density for the infectious disease models, by Hu et al., 2013 Mathematical Biosciences. 244(2):125-134. See the figure from that article below.
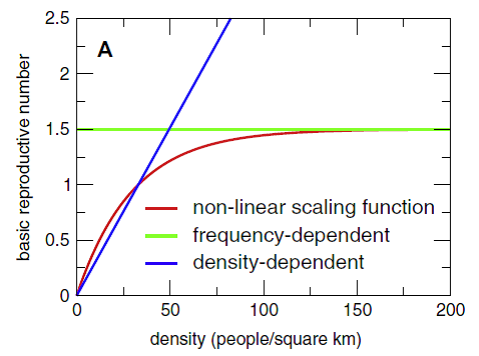
Figure 1: Effect of population density on transmissibility
The Generic/DensityScaling example scenario in the zipped EMODScenarios folder illustrates how population density can be configured to affect transmission. Review the README files there for more information.
The table below shows how setting Node_Grid_Size in that scenario to 0.1, 0.15, and 0.3 affects population density and R0 values.
Simulation |
Population |
Latitude, Longitude |
Node_Grid_Size |
Node Area |
Density |
R0 |
|---|---|---|---|---|---|---|
1 |
10,000 |
0, 0 |
0.1 |
124 |
80 |
R0> 1 |
2 |
10,000 |
0, 0 |
0.15 |
278 |
36 |
R0~ 1 |
3 |
10,000 |
0, 0 |
0.3 |
1112 |
9 |
R0< 1 |
The following graphs show the effect of population density on transmissibility, in terms of maintaining endemic status. When population density is large enough, it is easy to maintain an endemic status while in lower density is difficult to do so.
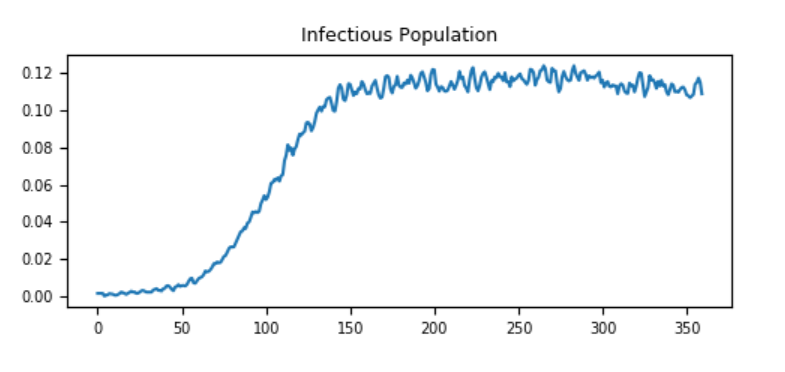
Figure 2: Node_Grid_Size = 0.1, population density 80/km2and R0 > 1
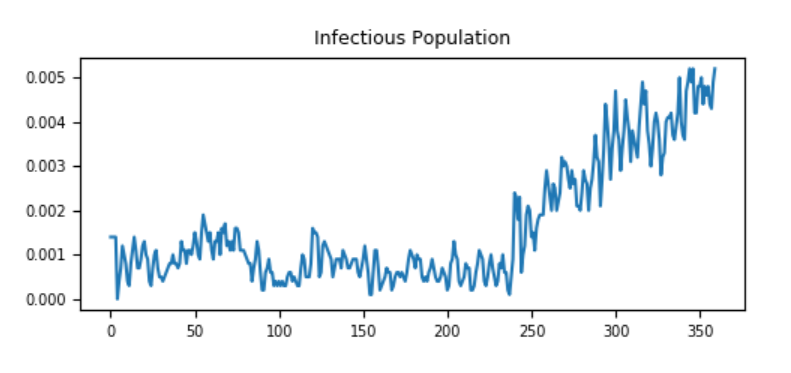
Figure 3: Node_Grid_Size = 0.15, population density 36/km2and R0 ~ 1
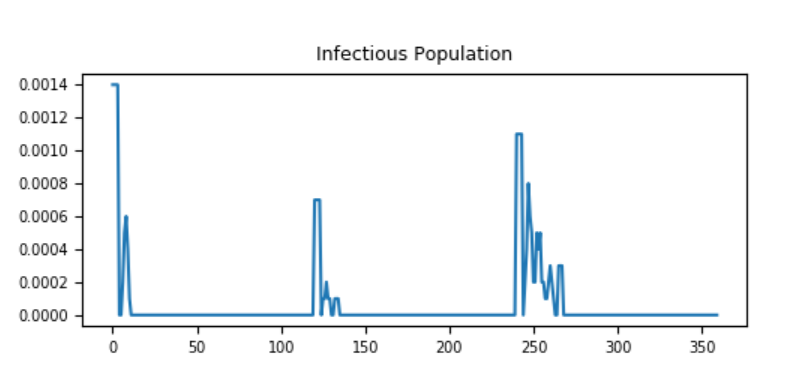
Figure 4: Node_Grid_Size = 0.3, population density 9/km2and R0 < 1