SIR and SIRS models
This topic describes the differential equations that govern the classic deterministic SIR and SIRS compartmental models and describes how to configure EMOD, an agent-based stochastic model, to simulate an SIR/SIRS epidemic. In SIR models, individuals in the recovered state gain total immunity to the pathogen; in SIRS models, that immunity wanes over time and individuals can become reinfected. The EMOD generic simulation uses an SEIR-like disease model by default. You can modify the default SEIR model to an SIR model by turning off the incubation period.
The SIR/SIRS diagram below shows how individuals move through each compartment in the model. The dashed line shows how the SIR model becomes an SIRS (Susceptible - Infectious - Recovered - Susceptible) model, where recovery does not confer lifelong immunity, and individuals may become susceptible again.
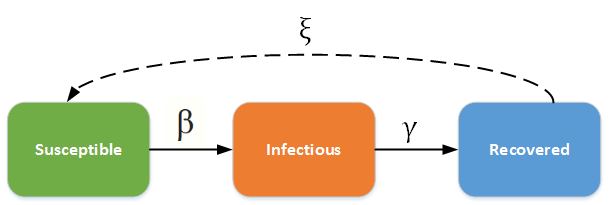
SIR - SIRS model
The infectious rate, \(\beta\), controls the rate of spread which represents the probability of transmitting disease between a susceptible and an infectious individual. Recovery rate, \(\gamma\) = 1/D, is determined by the average duration, D, of infection. For the SIRS model, \(\xi\) is the rate which recovered individuals return to the susceptible statue due to loss of immunity.
For a detailed comparison of how the SIR ordinary differential equation (ODE) can be rewritten in the stochastic EMOD model, see Compartmental models and EMOD.
SIR model
The SIR model was first used by Kermack and McKendrick in 1927 and has subsequently been applied to a variety of diseases, especially airborne childhood diseases with lifelong immunity upon recovery, such as measles, mumps, rubella, and pertussis. S, I and R represent the number of susceptible, infected, and recovered individuals, and N = S + I + R is the total population.
SIR without vital dynamics
If the course of the infection is short (emergent outbreak) compared with the lifetime of an individual and the disease is non-fatal, vital dynamics (birth and death) can be ignored. In the deterministic form, the SIR model can be written as the following ordinary differential equation (ODE):
where \(N = S + I + R\) is the total population.
In a closed population with no vital dynamics, an epidemic will eventually die out due to an insufficient number of susceptible individuals to sustain the disease. Infected individuals who are added later will not start another epidemic due to the lifelong immunity of the existing population.
The following graphs show the inset chart and charts for all channels in a typical SIR outbreak. To run this example simulation, see the Generic/SIR scenario in the downloadable EMOD scenarios zip file. Review the README files there for more information.
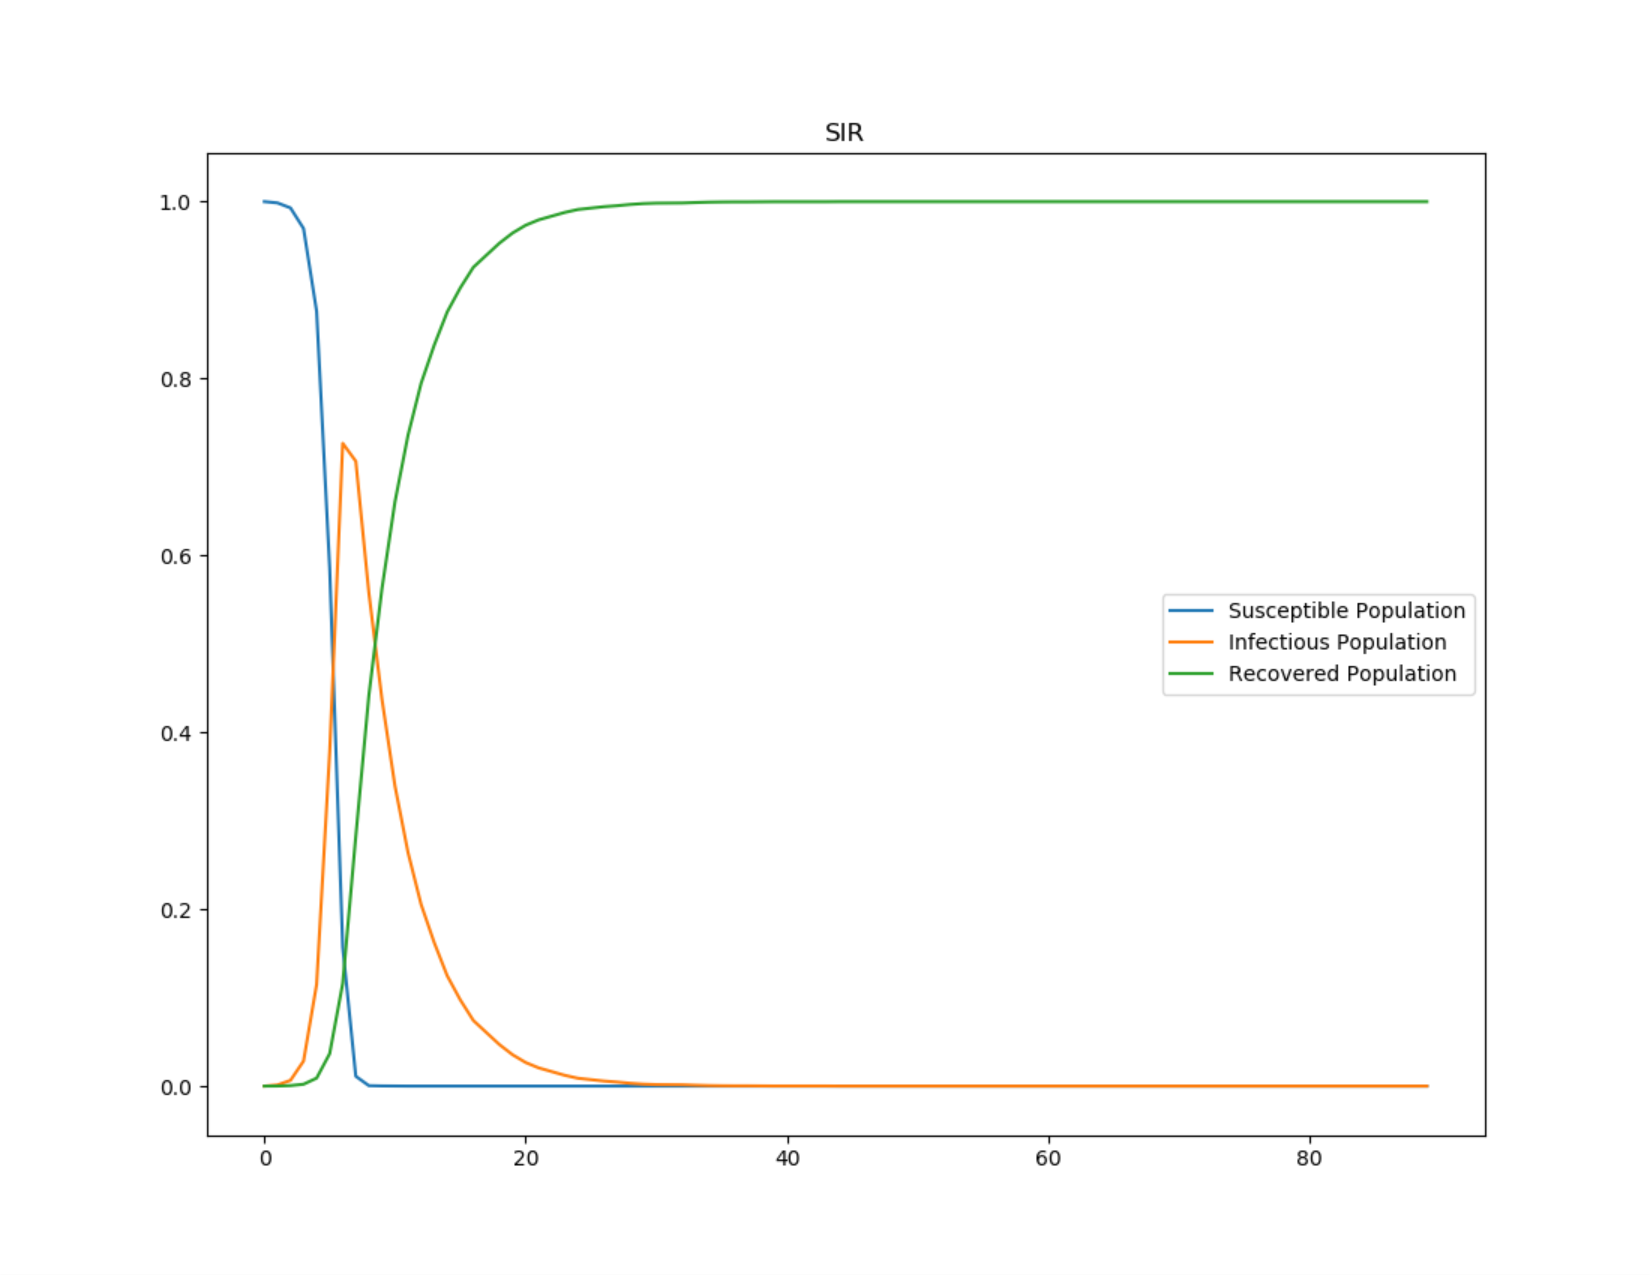
Figure 1: Growth of infection and depletion of the susceptible population in an SIR outbreak
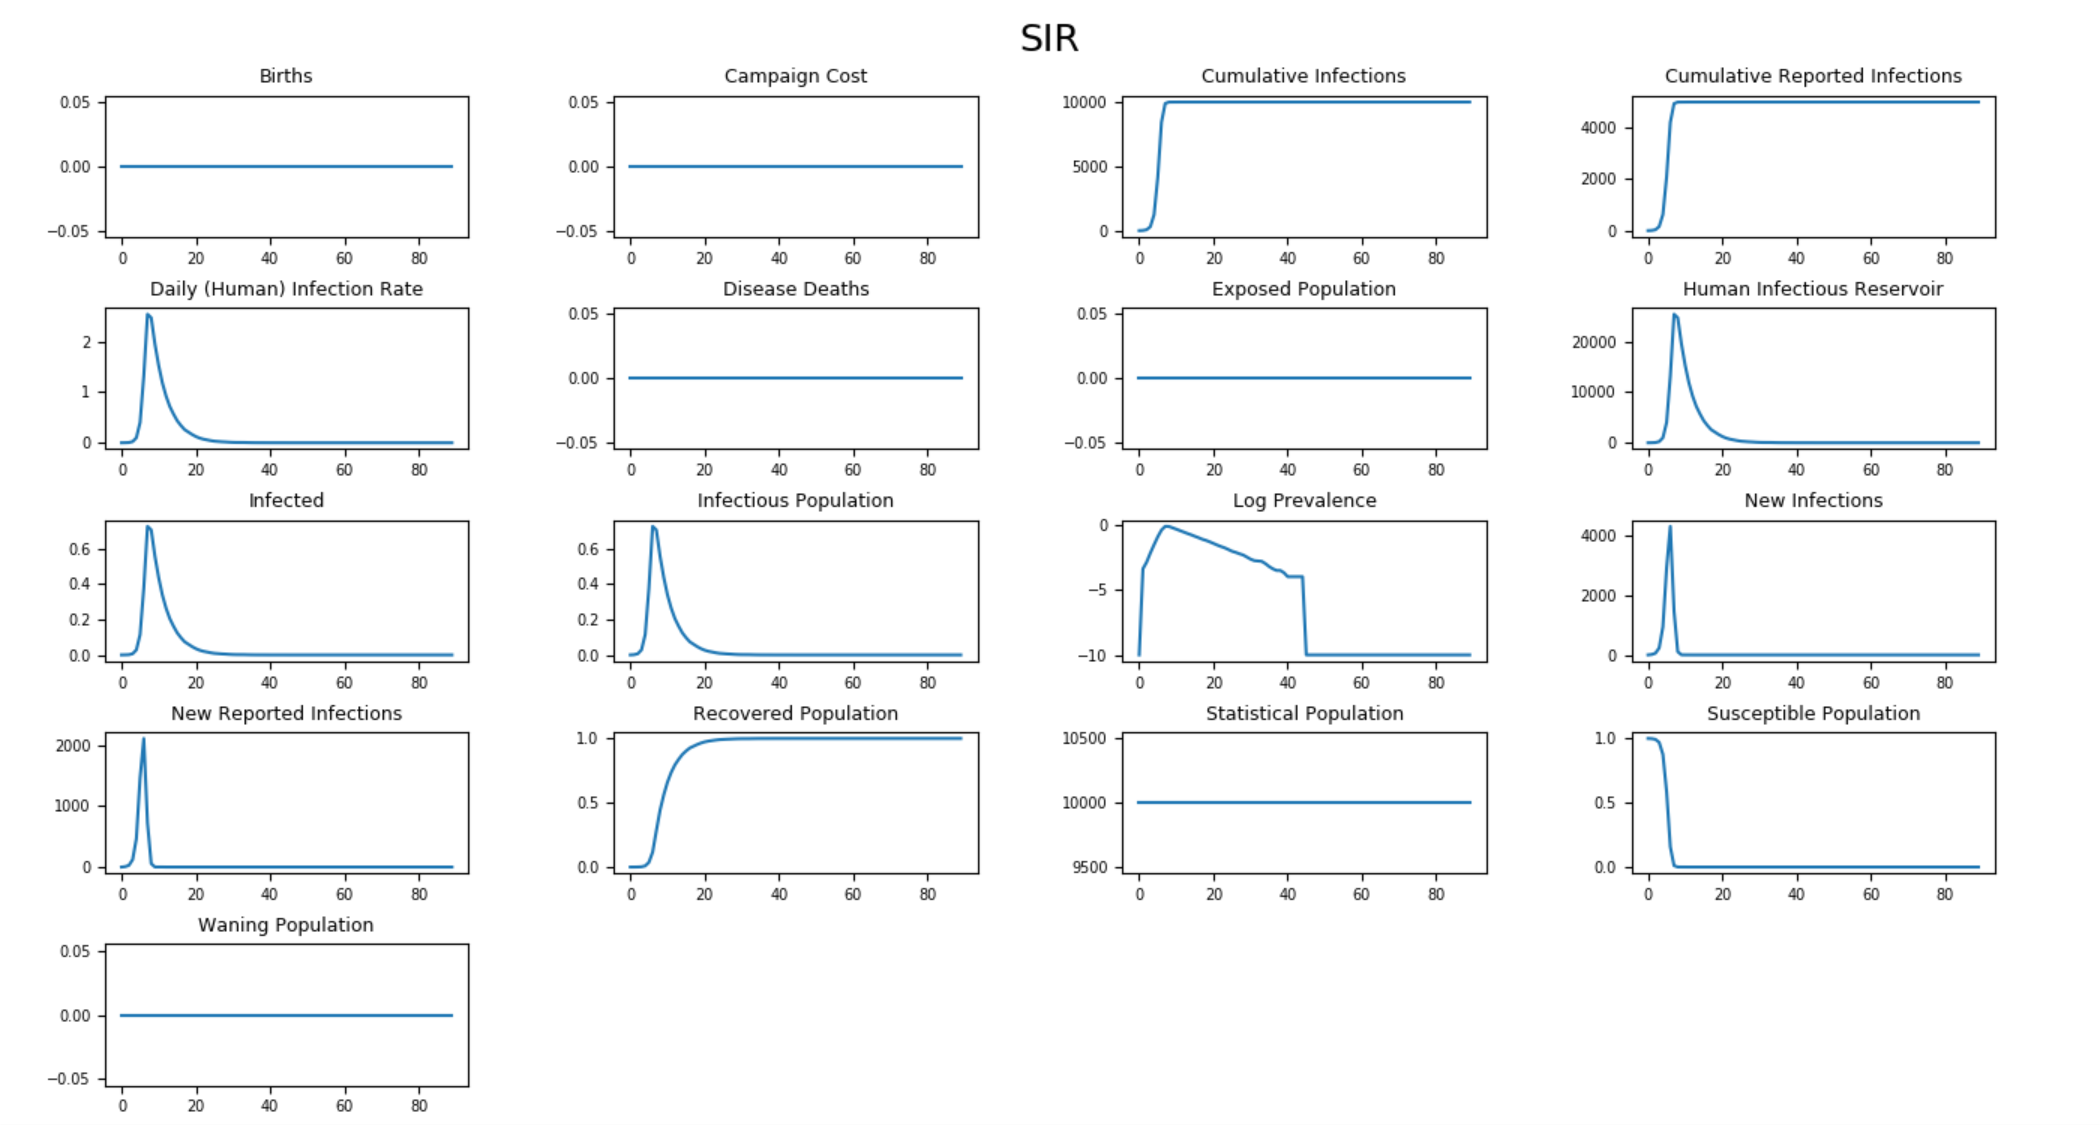
Figure 2: All output channels for SIR without vital dynamics
SIR with vital dynamics
However in a population with vital dynamics, new births can provide more susceptible individuals to the population, sustaining an epidemic or allowing new introductions to spread throughout the population. In a realistic population like this, disease dynamics will reach a steady state. This is the case when diseases are endemic to a region.
Let \(\mu\) and \(\nu\) represent the birth and death rates, respectively, for the model. To maintain a constant population, assume that \(\mu = \nu\). In steady state \(\frac{dI}{dt} = 0\). The ODE then becomes:
where \(N = S + I + R\) is the total population.
SIRS model
The SIR model assumes people carry lifelong immunity to a disease upon recovery; this is the case for a variety of diseases. For another class of airborne diseases, for example seasonal influenza, an individual’s immunity may wane over time. In this case, the SIRS model is used to allow recovered individuals to return to a susceptible state.
SIRS without vital dynamics
If there is sufficient influx to the susceptible population, at equilibrium the dynamics will be in an endemic state with damped oscillation. The ODE then becomes:
where \(N = S + I + R\) is the total population.
EMOD simulates waning immunity by a delayed exponential distribution. Individuals stay immune for a certain period of time then immunity wanes following an exponential distribution. For more information, see Immunity parameters.
The graphs below show damped oscillation due to people losing immunity and becoming susceptible again.
Note
Individuals who are susceptible people due to waning immunity are not classified as susceptible in the simulation. They are reported under the “Waning Population” channel.
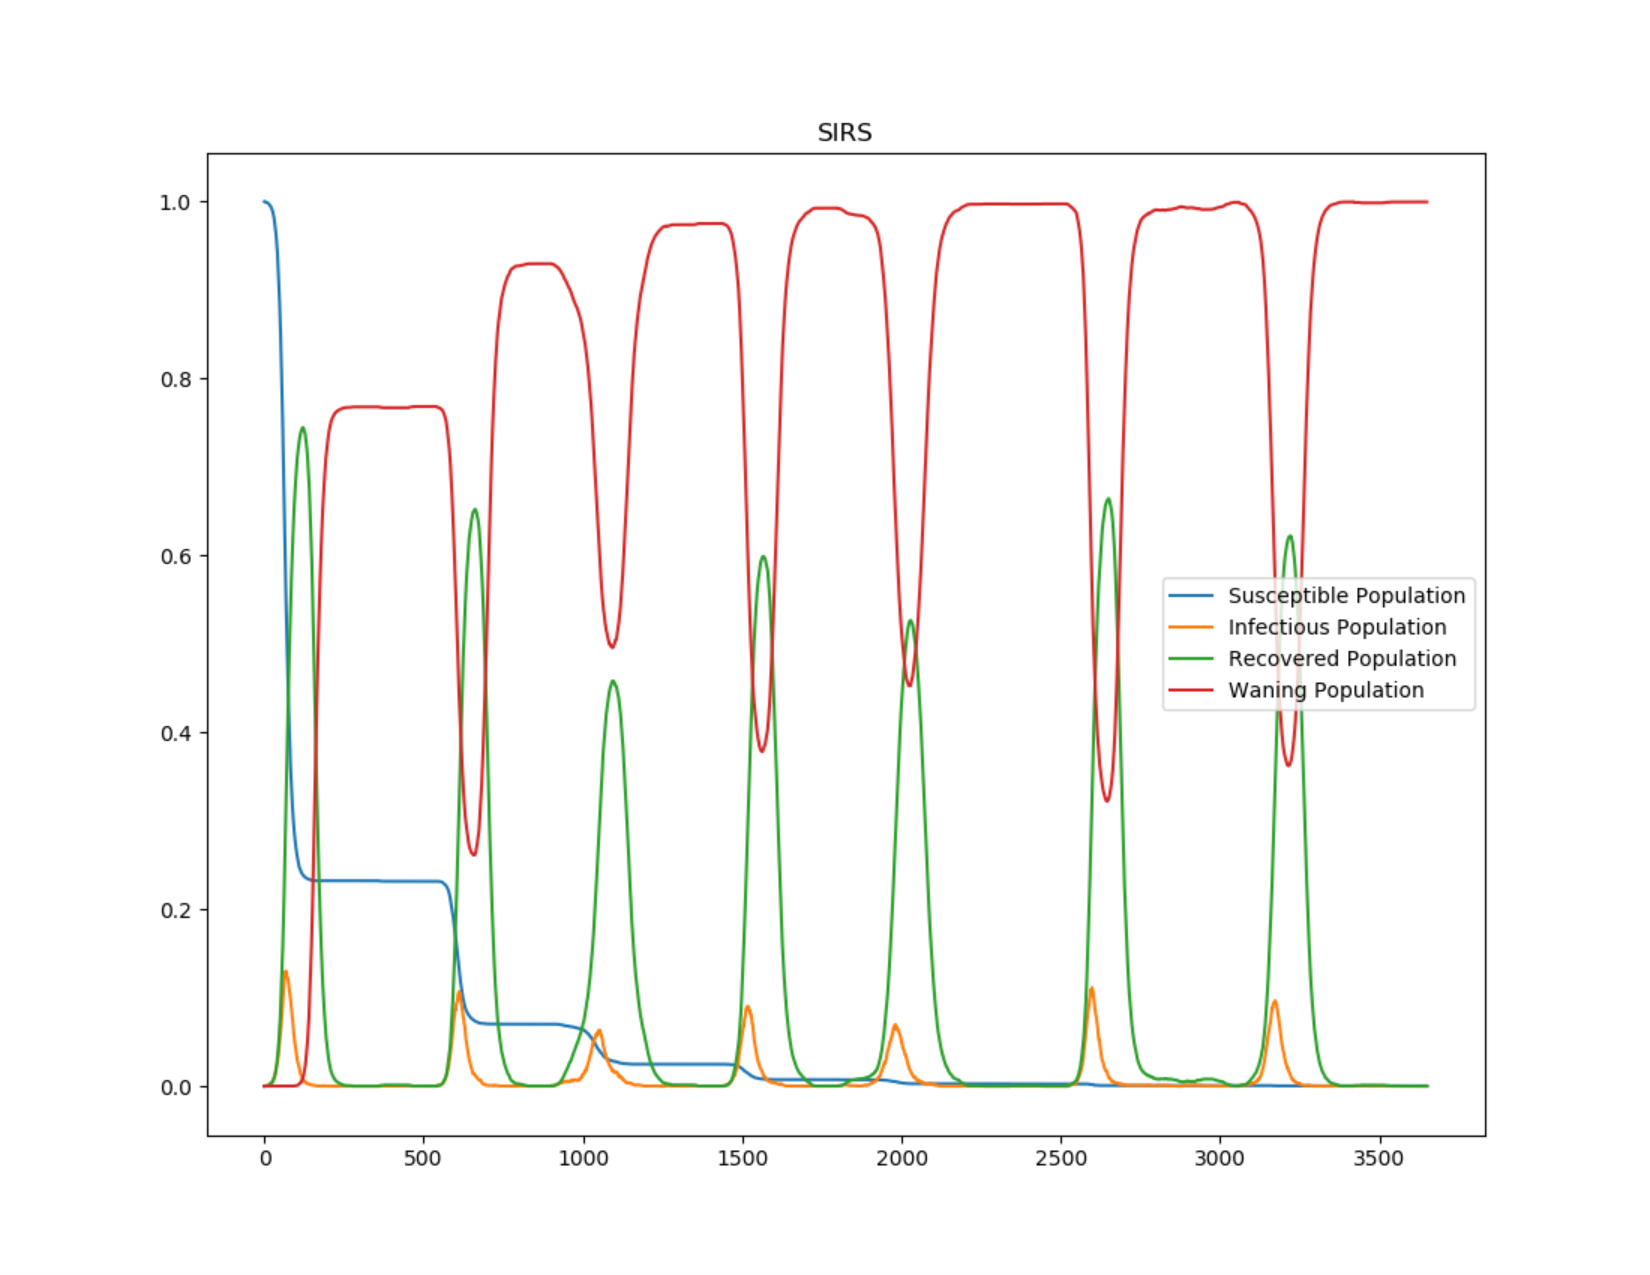
Figure 3: Damped oscillation in SIRS outbreak
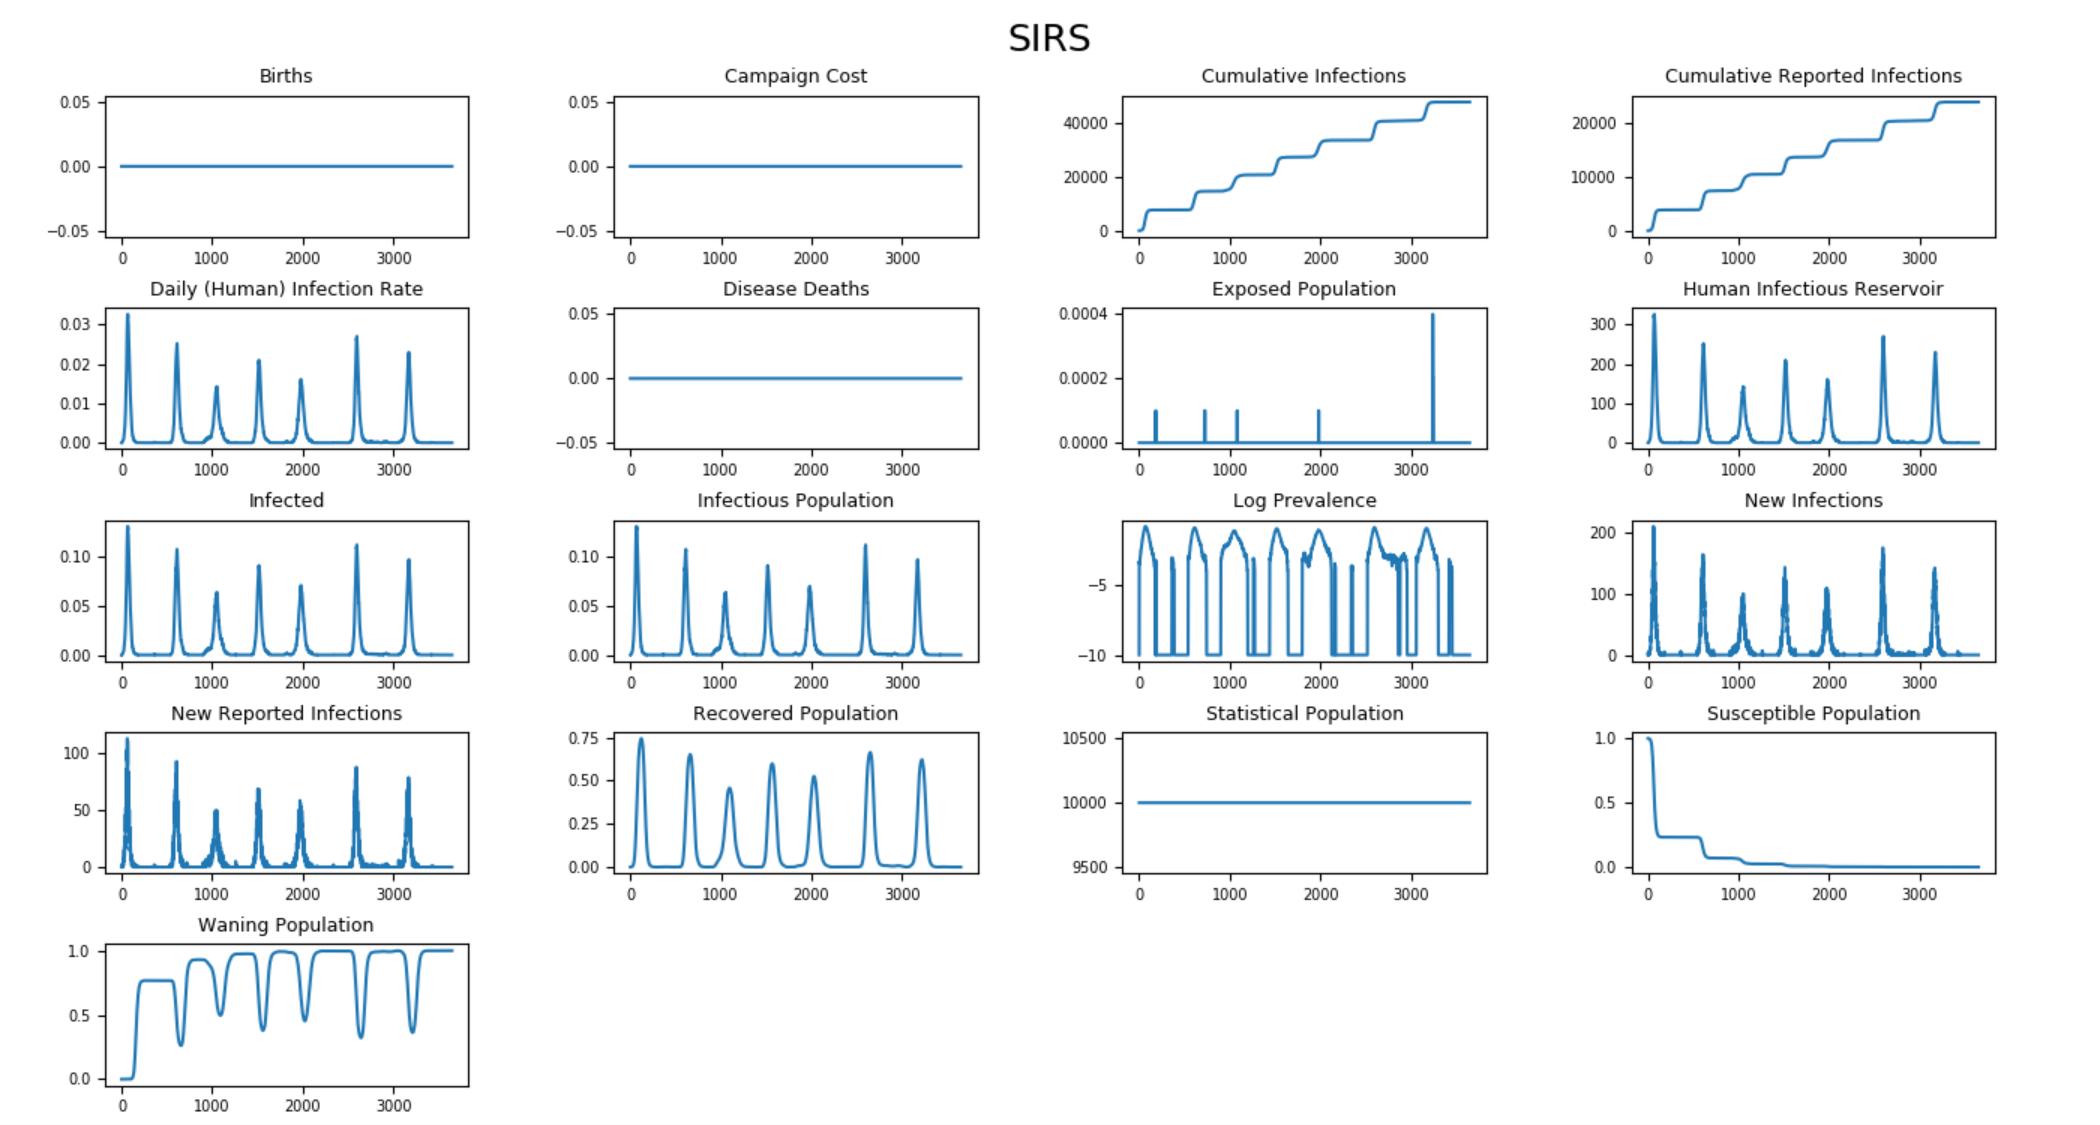
Figure 4: All output channels for SIRS without vital dynamics
To run this example simulation, see the Generic/SIRS scenario in the EMOD scenarios zip file. Review the README files there for more information.
SIRS with vital dynamics
You can also add vital dynamics to an SIRS model, where \(\mu\) and \(\nu\) again represent the birth and death rates, respectively. To maintain a constant population, assume that \(\mu = \nu\). In steady state \(\frac{dI}{dt} = 0\). The ODE then becomes:
where \(N = S + I + R\) is the total population.