Vital Dynamics#
This tutorial serves as an introduction to the different options for incorporating vital dynamics (births, deaths, and age structure) into the ABM model.
Vital dynamics is an essential component of modeling measles transmission, particularly the birth rate. The ABM model is the best for modeling age-pbased transmission so this tutorial goes over some of the components you can use to setup the models.
We start with some basic imports
[1]:
from laser.measles.abm import ABMModel, ABMParams, VitalDynamicsProcess, ConstantPopProcess, VitalDynamicsParams, ConstantPopParams, PopulationTracker, WPPVitalDynamicsProcess, AgePyramidTracker
from laser.measles.scenarios import synthetic
from laser.measles import create_component
import matplotlib.pyplot as plt
import numpy as np

params = ABMParams(num_ticks=365)
scenario = synthetic.two_patch_scenario()
And define a custom component to track the lentht of the laserframe. This does not indicate the total size of the people laserframe (the capacity), but rather the number of agents who have entered the simulation.
[2]:
from laser.measles.base import BasePhase
class PeopleLengthTracker(BasePhase):
    def __init__(self, model, verbose):
        super().__init__(model, verbose=verbose)
        self.laserframe_tracker = np.zeros((model.params.num_ticks,))
    def __call__(self, model, tick):
        self.laserframe_tracker[tick] = len(model.people)
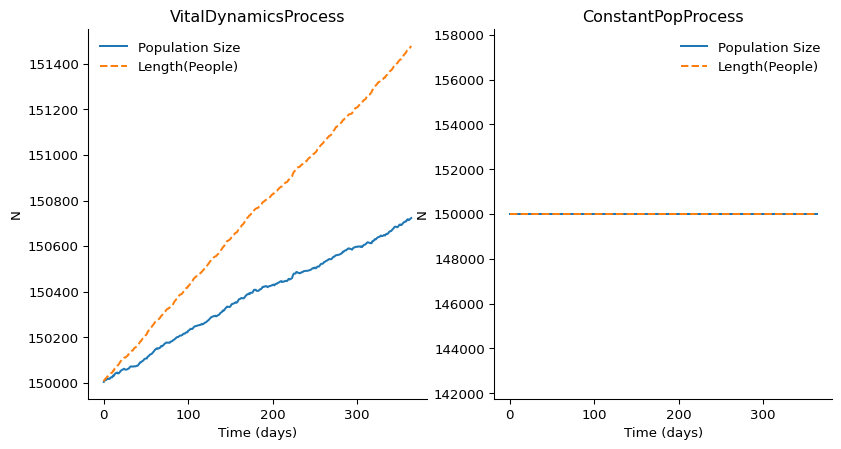
VitalDynamics and ContantPop processes#
The VitalDynamicsProcess and ConstantPopProcess take constant crude birth rates (births per 1k pop per year) as well as death rates (in the case of the former). Below we compare how the length of the laserframe increases compared to the total population. Using the VitalDynamicsProcess we see that the length of the laserframe is greater than the population size because agents that die remain in the computer memory while the ConstantPopProcess recycles elements in the arrays as
agents enter and leave the simulation.
[3]:
with plt.style.context('sciris.simple'):
    fig, axs = plt.subplots(1,2,figsize=(10, 5))
    for i, process in enumerate([VitalDynamicsProcess, ConstantPopProcess]):
        model = ABMModel(scenario, params)
        if issubclass(process, VitalDynamicsProcess):
            vd_params = VitalDynamicsParams(crude_birth_rate=10, crude_death_rate=5)
        else:
            vd_params = ConstantPopParams(crude_birth_rate=0)
        model.components = [create_component(process, vd_params), PopulationTracker, PeopleLengthTracker]
        model.run()
        kwargs = {'color': f'C{i}'}
        axs[i].plot(model.get_component("PopulationTracker")[0].population_tracker.sum(axis=0), label='Population Size')
        axs[i].plot(model.get_component("PeopleLengthTracker")[0].laserframe_tracker, linestyle='--', label='Length(People)')
        axs[i].set_title(process.__name__)
        axs[i].set_xlabel('Time (days)')
        axs[i].set_ylabel('N')
        axs[i].legend()
|████████████████████████████████████████| 365/365 [100%] in 0.1s (4672.71/s)
|████████████████████████████████████████| 365/365 [100%] in 0.0s (98995.56/s)
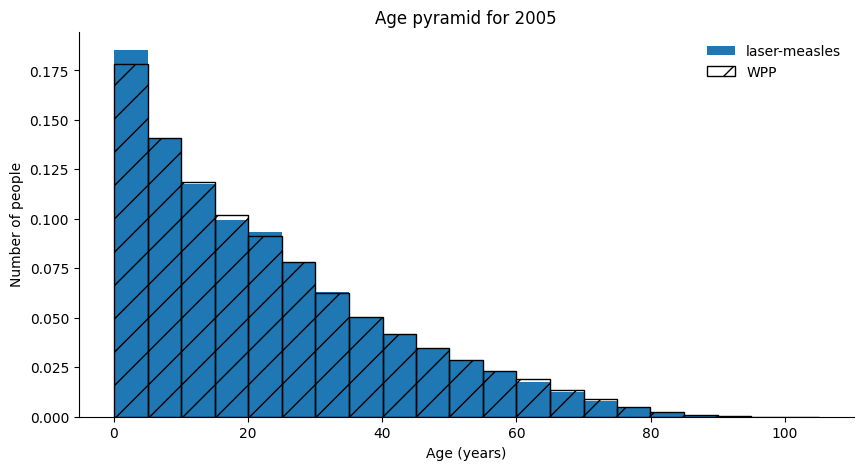
WPP vital dynamics with age structure#
The WPPVitalDynamicsProcess uses World Population Prospect (WPP) estimates to set overall birth rates and age structured mortality rates.
[4]:
model = ABMModel(scenario, params = ABMParams(num_ticks=5*365+3))
model.components = [WPPVitalDynamicsProcess, AgePyramidTracker]
model.run()
year = 2005
tracker = model.get_component("AgePyramidTracker")[0]
age_pyramid = tracker.age_pyramid[f'{year}-01-01']
|████████████████████████████████████████| 1828/1828 [100%] in 12.9s (142.08/s)
Now we plot the age pyramid after 5 years of running the simulation and compare to WPP data.
[5]:
import pyvd
wpp_data = pyvd.make_pop_dat('NGA')
wpp_years = wpp_data[0]
wpp_pop = wpp_data[1:]
bins = np.array(tracker.params.age_bins) / 365
with plt.style.context('sciris.simple'):
    plt.figure(figsize=(10, 5))
    plt.bar(bins[:-1], age_pyramid/np.sum(age_pyramid),
        width=np.diff(bins), align='edge', label='laser-measles')
    ind = np.argmin(np.abs(wpp_years - year))
    plt.bar(bins, wpp_pop[:,ind]/np.sum(wpp_pop[:,ind]),
        width=np.concatenate([np.diff(bins), [5]]), align='edge',
        label='WPP', hatch='/', color='k', fill=False)
    plt.xlabel('Age (years)')
    plt.ylabel('Number of people')
    plt.title(f'Age pyramid for {year}')
    plt.legend()
    plt.show()