Notebooks included in the documentation serve as tutorials to teach new users about key features or workflows of the tool. Lead with a paragraph that describes the overall purpose of the notebook and list the actions contained within the tutorial.
Consider execution time when writing notebooks, both for its impact on the user experience and on documentation builds. Aim for 60 seconds per notebook or less and consider downsampling the population size or other ways to speed up execution as appropriate. Execute notebooks as part of every documentation build or just as part of the GitHub Actions builds, but do not include notebooks without regularly executing them to verify validity.
If you want to include notebooks in the project for other purposes, such as demonstrating scientific validity or testing functionality, those notebooks should live outside the documentation. Limit notebooks in the documentation just to ones that new users will want to read or run to gain familiarity with the tool.
If there are other topics that provide relevant context, add links to them (note: in MkDocs, links should be to the parent folder and without the extension, e.g. example.md in the same folder as the notebook should be linked as [example](../example); in Quarto, just link directly, e.g. [example](example.md)).
Mixing executable code with explanatory prose is a great teaching tool; be sure to include ample explanation of both input code and output plots. We strongly recommend providing users the ability to interactively run notebooks in their browser by providing a link to a compute server (recommend Binder). Interaction helps solidify learning. You can create individual buttons to Binder in each notebook using the format:
To open an interactive version of this notebook, click . Note that it may take a few minutes to create the environment and edits will not be saved.
Prerequisites
Include a list of any explanation topics the reader should be familiar with or other tutorials that must be completed before running this tutorial.
First step
Include a descriptive heading followed by an explanation of the code sample that will follow to help guide the reader’s learning experience. Code samples should include extensive comments.
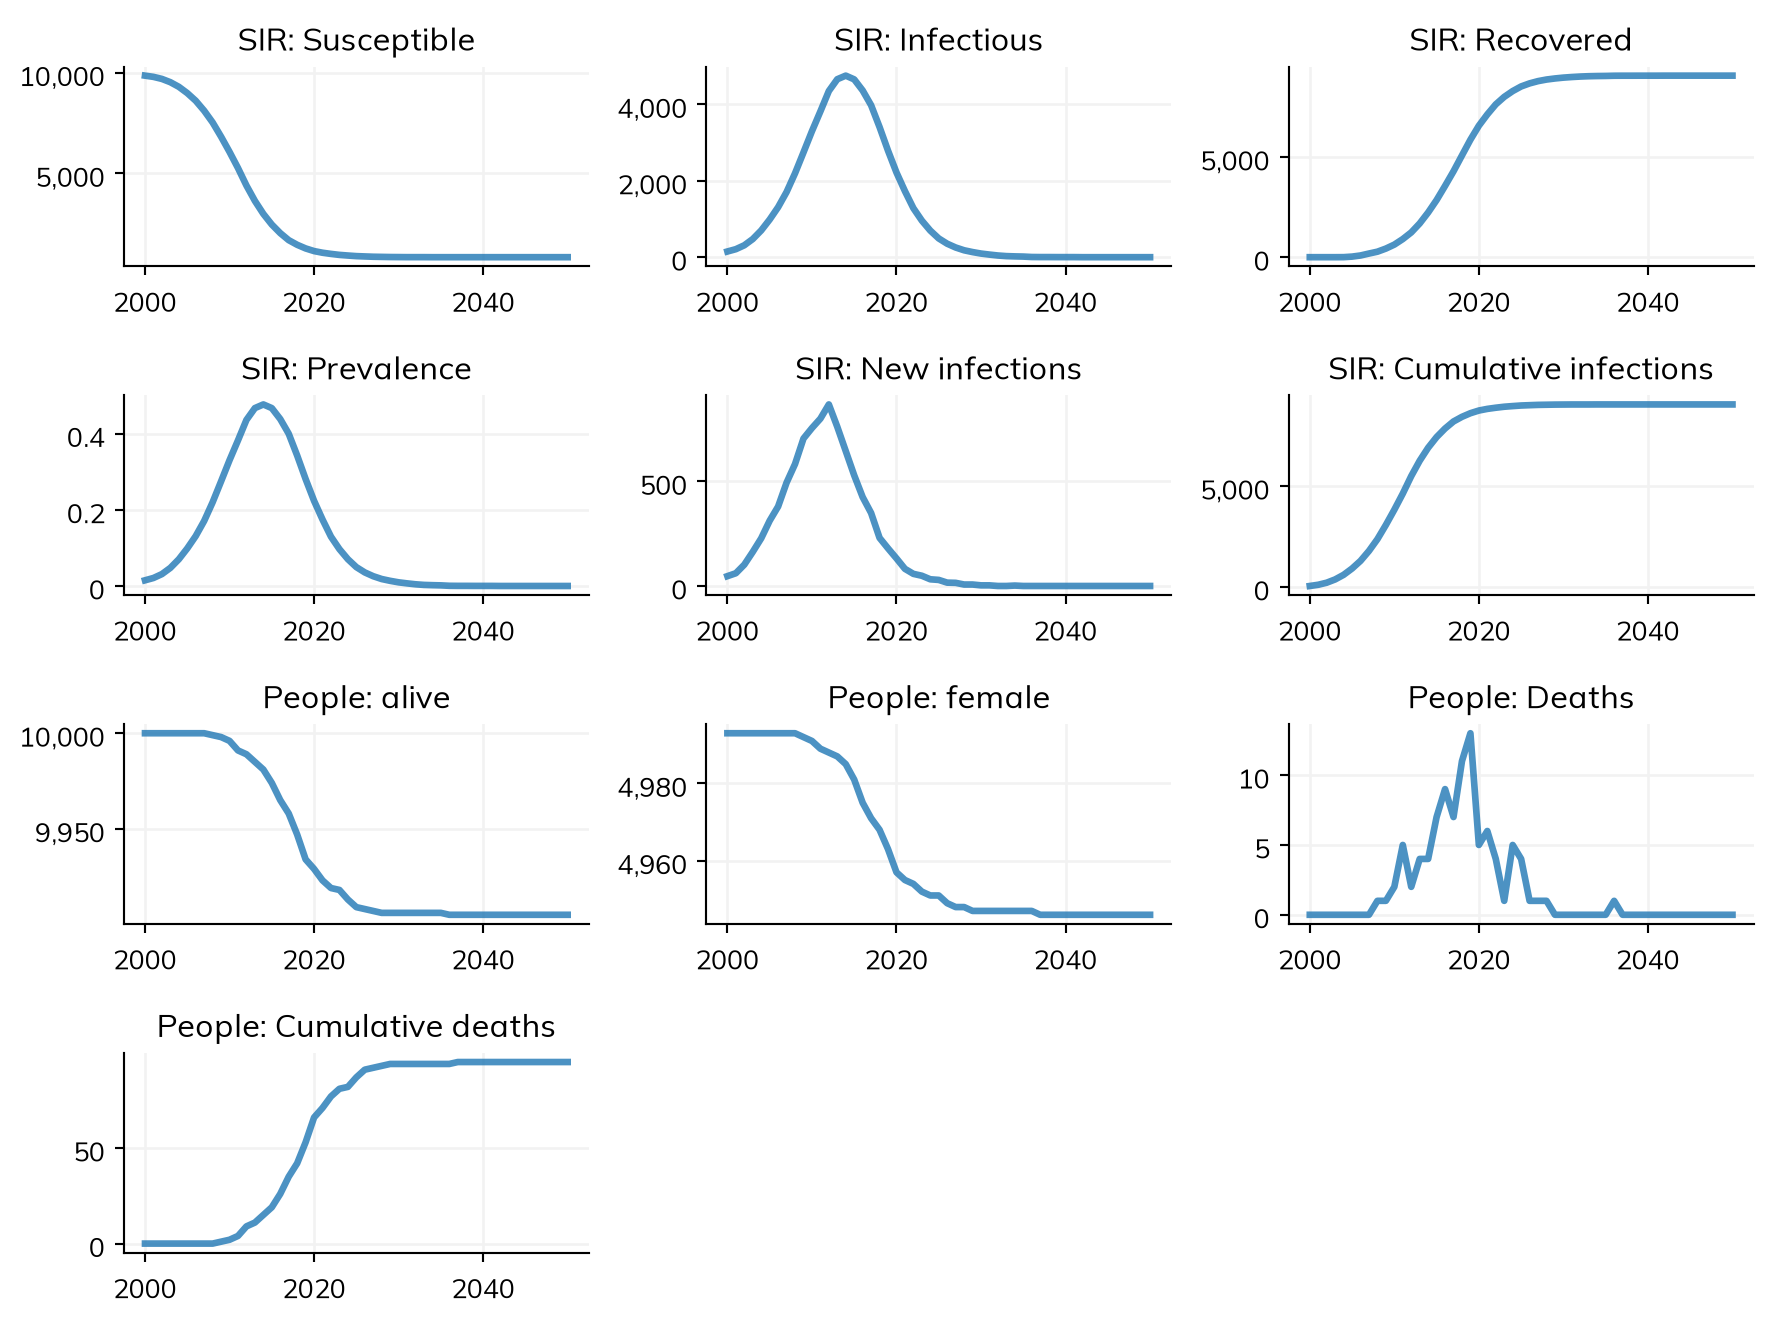
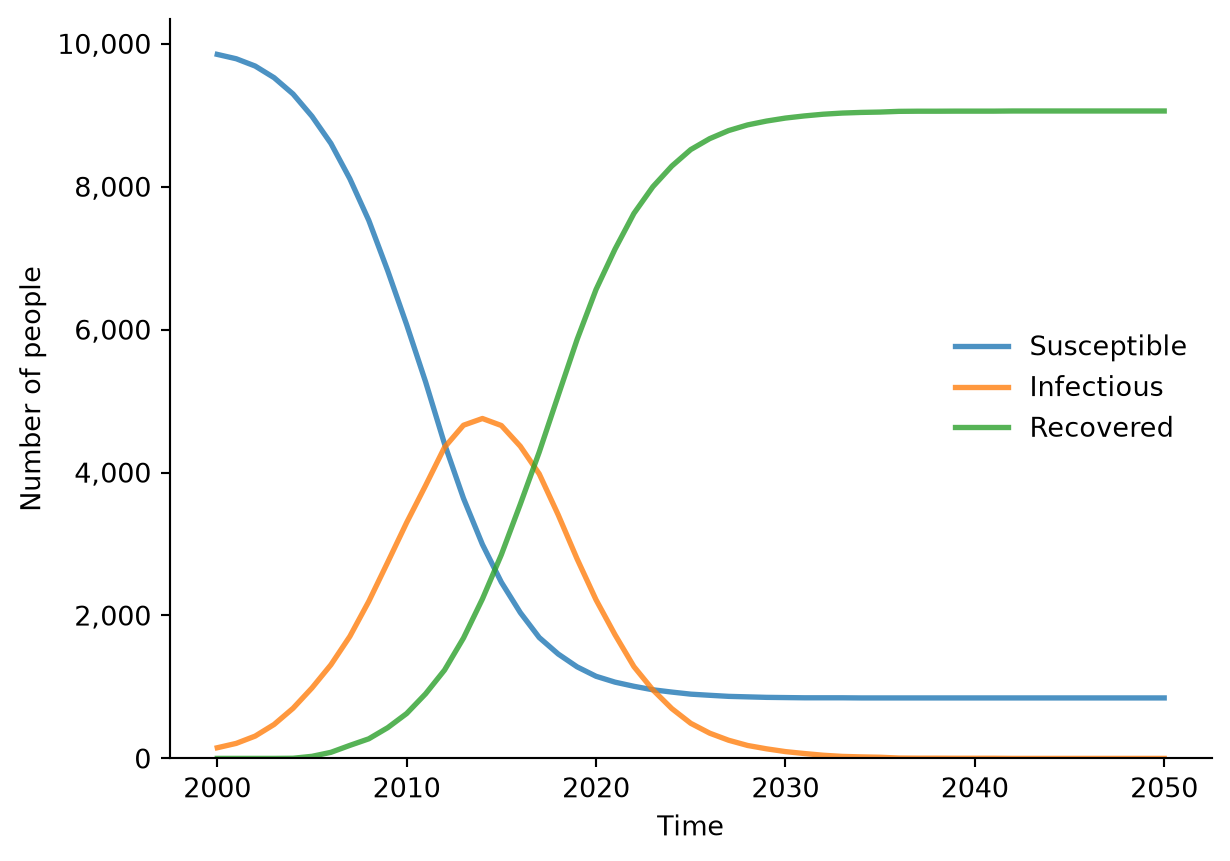
%matplotlib inlineimport starsim as ss# Define the parameterspars =dict( n_agents =10_000, # Number of agents to simulate networks =dict( # *Networks* add detail on how the agents interact with each othertype='random', # Here, we use a 'random' network n_contacts =10# Each person has an average of 10 contacts with other people ), diseases =dict( # *Diseases* add detail on what diseases to modeltype='sir', # Here, we're creating an SIR disease init_prev =0.01, # Proportion of the population initially infected beta =0.05, # Probability of transmission between contacts ))# Make the sim, run and plotsim = ss.Sim(pars)sim.run()sim.plot()sim.diseases.sir.plot()
Rebuilding font cache, please be patient...
Font cache rebuilt in folder: /home/runner/.cache/matplotlib

Note: rebuilding the font cache only happens once on first import, or set the environment variable STARSIM_INSTALL_FONTS=0 to disable.
Initializing sim with 10000 agents

  Running 2000 ( 0/51) (0.00 s)  ———————————————————— 2%

  Running 2010 (10/51) (0.92 s)  ••••———————————————— 22%

  Running 2020 (20/51) (0.98 s)  ••••••••———————————— 41%

  Running 2030 (30/51) (1.03 s)  ••••••••••••———————— 61%

  Running 2040 (40/51) (1.07 s)  ••••••••••••••••———— 80%

  Running 2050 (50/51) (1.11 s)  •••••••••••••••••••• 100%

Figure(896x672)
Figure(672x480)
If necessary, provide follow-up context or note relevant features of the output plots.
Second step
Include a descriptive heading followed by explanation for any subsequent steps in the tutorial, and so on.