InsetChart
The inset chart (InsetChart.json) is an output report that is automatically generated with every simulation. It contains simulation-wide averages, one per time step, for a wide number of data channels. The channels are fully specified by the simulation type and cannot be altered without making changes to the EMOD source code. Python or other tools can be used to create charts out of the information contained in the file (see the example charts provided at the end of this page.)
Configuration
To generate this report, make sure the Enable_Default_Reporting parameter is set to 1 in the config.json file.
Output file data
Headers
When running malaria simulations, the header section will contain the following parameters.
Parameter |
Data type |
Description |
|---|---|---|
DateTime |
string |
The time stamp indicating when the report was generated. |
DTK_Version |
string |
The version of EMOD used. |
Report_Type |
string |
The type of output report. |
Report_Version |
string |
The format version of the report. |
Start_Time |
integer |
The time in days when the simulation begins. |
Simulation_Timestep |
integer |
The number of days in each time step. |
Timesteps |
integer |
The number of time steps in the simulation. |
Channels |
integer |
The number of channels in the simulation. |
Channels
When running malaria simulations, the following channels are included in the InsetChart.json file. Note that the diagnostic channels are calculated once each time step and the same results of the diagnostic are used in all reports.
Note that you cannot generate a separate InsetChart by node; to do so, use ReportMalariaFiltered.
Channel |
Description |
|---|---|
30-day Av Infection Duration |
A running average of the duration of each infection that cleared in the last 30 days (both naturally and due to drugs). Use Inset_Chart_Reporting_Include_30Day_Avg_Infection_Duration to control the presence of this channel. The default is to include the channel. |
Adult Vectors |
The average number of adult vectors per node. |
Air Temperature |
The average air temperature, in Celsius, on that day per node. |
Avg Num Infections |
The average number of infections, per person (infected people only) on that day. These are all the infections the individual has and may not be detectable by diagnostics. Note that this may not equal the number of infected people as people may have multiple infections. |
Avg Num Vector Infs |
The average number of infections per infected/infectious vector. This number implies that the infections are different in either time or genetics of the parasite. This channel is included when Malaria_Model is set to MALARIA_MECHANISTIC_MODEL_WITH_PARASITE_GENETICS. |
Births |
The live births cumulative up to that day. |
Blood Smear Gametocyte Prevalence |
The fraction of the population that is detectable with the BLOOD_SMEAR_GAMETOCYTES version of MalariaDiagnostic. The detectability of the diagnostic is controlled by the parameters Report_Gametocyte_Smear_Sensitivity and Report_Detection_Threshold_Blood_Smear_Gametocytes. |
Blood Smear Parasite Prevalence |
The fraction of the population that is detectable with the BLOOD_SMEAR_PARASITES version of MalariaDiagnostic. The detectability of the diagnostic is controlled by parameters Report_Parasite_Smear_Sensitivity and Report_Detection_Threshold_Blood_Smear_Parasites. |
Campaign Cost |
The cost of campaigns cumulative up to that day (set by the Cost_To_Consumer parameter in each intervention). |
Daily Bites per Human |
The average number of mosquito bites received per individual on that day. |
Daily EIR |
The entomological inoculation rate (EIR), or number of infected mosquito bites each individual receives each day, on average. |
Disease Deaths |
The number of individuals whose death is attributed to malaria, cumulative up to that day. |
Fever Prevalence |
The fraction of the population currently with a fever. Detectable fever is determined by the parameter Report_Detection_Threshold_Fever, the level of temperature above normal (Celsius) for an individual to be considered to have a fever. |
Has_<Intervention> |
The fraction of the population that has the given intervention. There is one channel for each entry in the parameter Inset_Chart_Has_Interventions. The parameter contains a list of intervention names that you can define in the campaign for the intervention using the parameter Intervention_Name. This only pertains to those interventions that persist in the individual from one time step to the next. You can use this channel as a simple debugging tool to see if and when interventions are distributed. If Inset_Chart_Has_Interventions is an empty list, there are no channels. The parameter does not validate the entries. |
HasIP_<Key>:<Value> |
The fraction of the population that has this Value for the individual property Key. There will be one channel for each value of each individual property key listed in the configuration parameter Inset_Chart_Has_IP. If Inset_Chart_Has_IP is an empty list, there will be no channels added to the report. They keys provided in the parameter must be defined in the demographics. |
Human Infectious Reservoir |
The expected number of infections from human to vector, including human immunity and within-host interventions but not vector control interventions, if each human were bitten by one vector that day. The average infectiousness per individual in the simulation. |
Infected |
The fraction of the population currently infected. |
Infected and Infectious Vectors |
The fraction of adult female vectors that are either infected or infectious. These vectors could have either oocyts, sporozoites or both. This channel is included when Malaria_Model is set to MALARIA_MECHANISTIC_MODEL_WITH_PARASITE_GENETICS. |
Infectious Vectors |
The fraction of vectors in the simulation that are currently infected and infectious. |
Land Temperature |
The average land temperature per node, in Celsius, on that day. |
Log Prevalence |
The logarithm of the population prevalence. Log10 of the infected channel. |
Mean Parasitemia |
The geometric mean number of parasites per microliter of blood. [Exponential of (Sum of log(BLOOD_SMEAR_PARASITES diagnostic) for all individuals divided by the number of individuals detected using (BLOOD_SMEAR_PARASITES) diagnostic – geometric mean]. |
New Clinical Cases |
The number of new clinical cases on that day. This channel is controlled by the Clinical_Fever_Threshold_Low and Clinical_Fever_Threshold_High parameters. The amount that an individual’s fever is above normal must be greater than both of these values to be considered clinical. |
New Infections |
The number of individuals who got infected on that day. Because an individual could receive multiple infections in a single day, this is not the number of total new infections on that day. The Malaria_Model parameter controls the number of new infections possible per person per day. |
New Vector Infections |
The number of new infections occurring in vectors on that day. Since vectors only feed once per day, it is also the number of vectors that received an infection that day. This could be an infected or infectious vector taking on more gametocytes. This channel is included when Malaria_Model is set to MALARIA_MECHANISTIC_MODEL_WITH_PARASITE_GENETICS. |
New Severe Cases |
The number of new severe cases of malaria on that day. An individual is considered to be a severe case if the combined probability of anemia, parasite density, and fever is greater than a uniform random number. This combined probability is the combination of sigmoid using the following parameters: Anemia_Severe_Threshold and Anemia_Severe_Inverse_Width, Parasite_Severe_Threshold and Parasite_Severe_Inverse_Width, and Fever_Severe_Threshold and Fever_Severe_Inverse_Width. For more information see Malaria symptoms and diagnostics. |
Newly Symptomatic |
50% of new infections are randomly selected to be ‘symptomatic’. |
PCR Gametocyte Prevalence |
The fraction of the population that is detectable with the PCR_GAMETOCYTES version of MalariaDiagnostic. The detectability of the diagnostic is controlled by parameter Report_Detection_Threshold_PCR_Gametocytes. |
PCR Parasite Prevalence |
The fraction of the population that is detectable with the PCR_PARASITES version of MalariaDiagnostic. The detectability of the diagnostic is controlled by parameter Report_Detection_Threshold_PCR_Parasites. |
PfHRP2 Prevalence |
The fraction of the population that is detectable with the PF_HRP2 version of MalariaDiagnostic. The detectability of the diagnostic is controlled by parameter Report_Detection_Threshold_PCR_PfHRP2. |
Rainfall |
The average number in millimeters of rainfall per node on that day. |
Relative Humidity |
The average relative humidity per node on that day. |
Statistical Population |
The total number of individuals in the simulation on that day. |
Symptomatic Population |
Not connected in Malaria simulations. |
True_Prevalence |
The fraction of the population that is detectable with the TRUE_PARASITE_DENSITY version of MalariaDiagnostic. The detectability of the diagnostic is controlled by the parameter Report_Detection_Threshold_True_Parasite_Density. |
Variant Fraction-PfEMP1 Major |
The average of the fraction of variants of the PfEMP1 var genes that an individual has had. The parameter Falciparum_PfEMP1_Variants defines the total number of possible variants. This channel indicates the average fraction that an individual has seen of this total number. The greater the fraction the more that the population has developed antibodies to the parasite. |
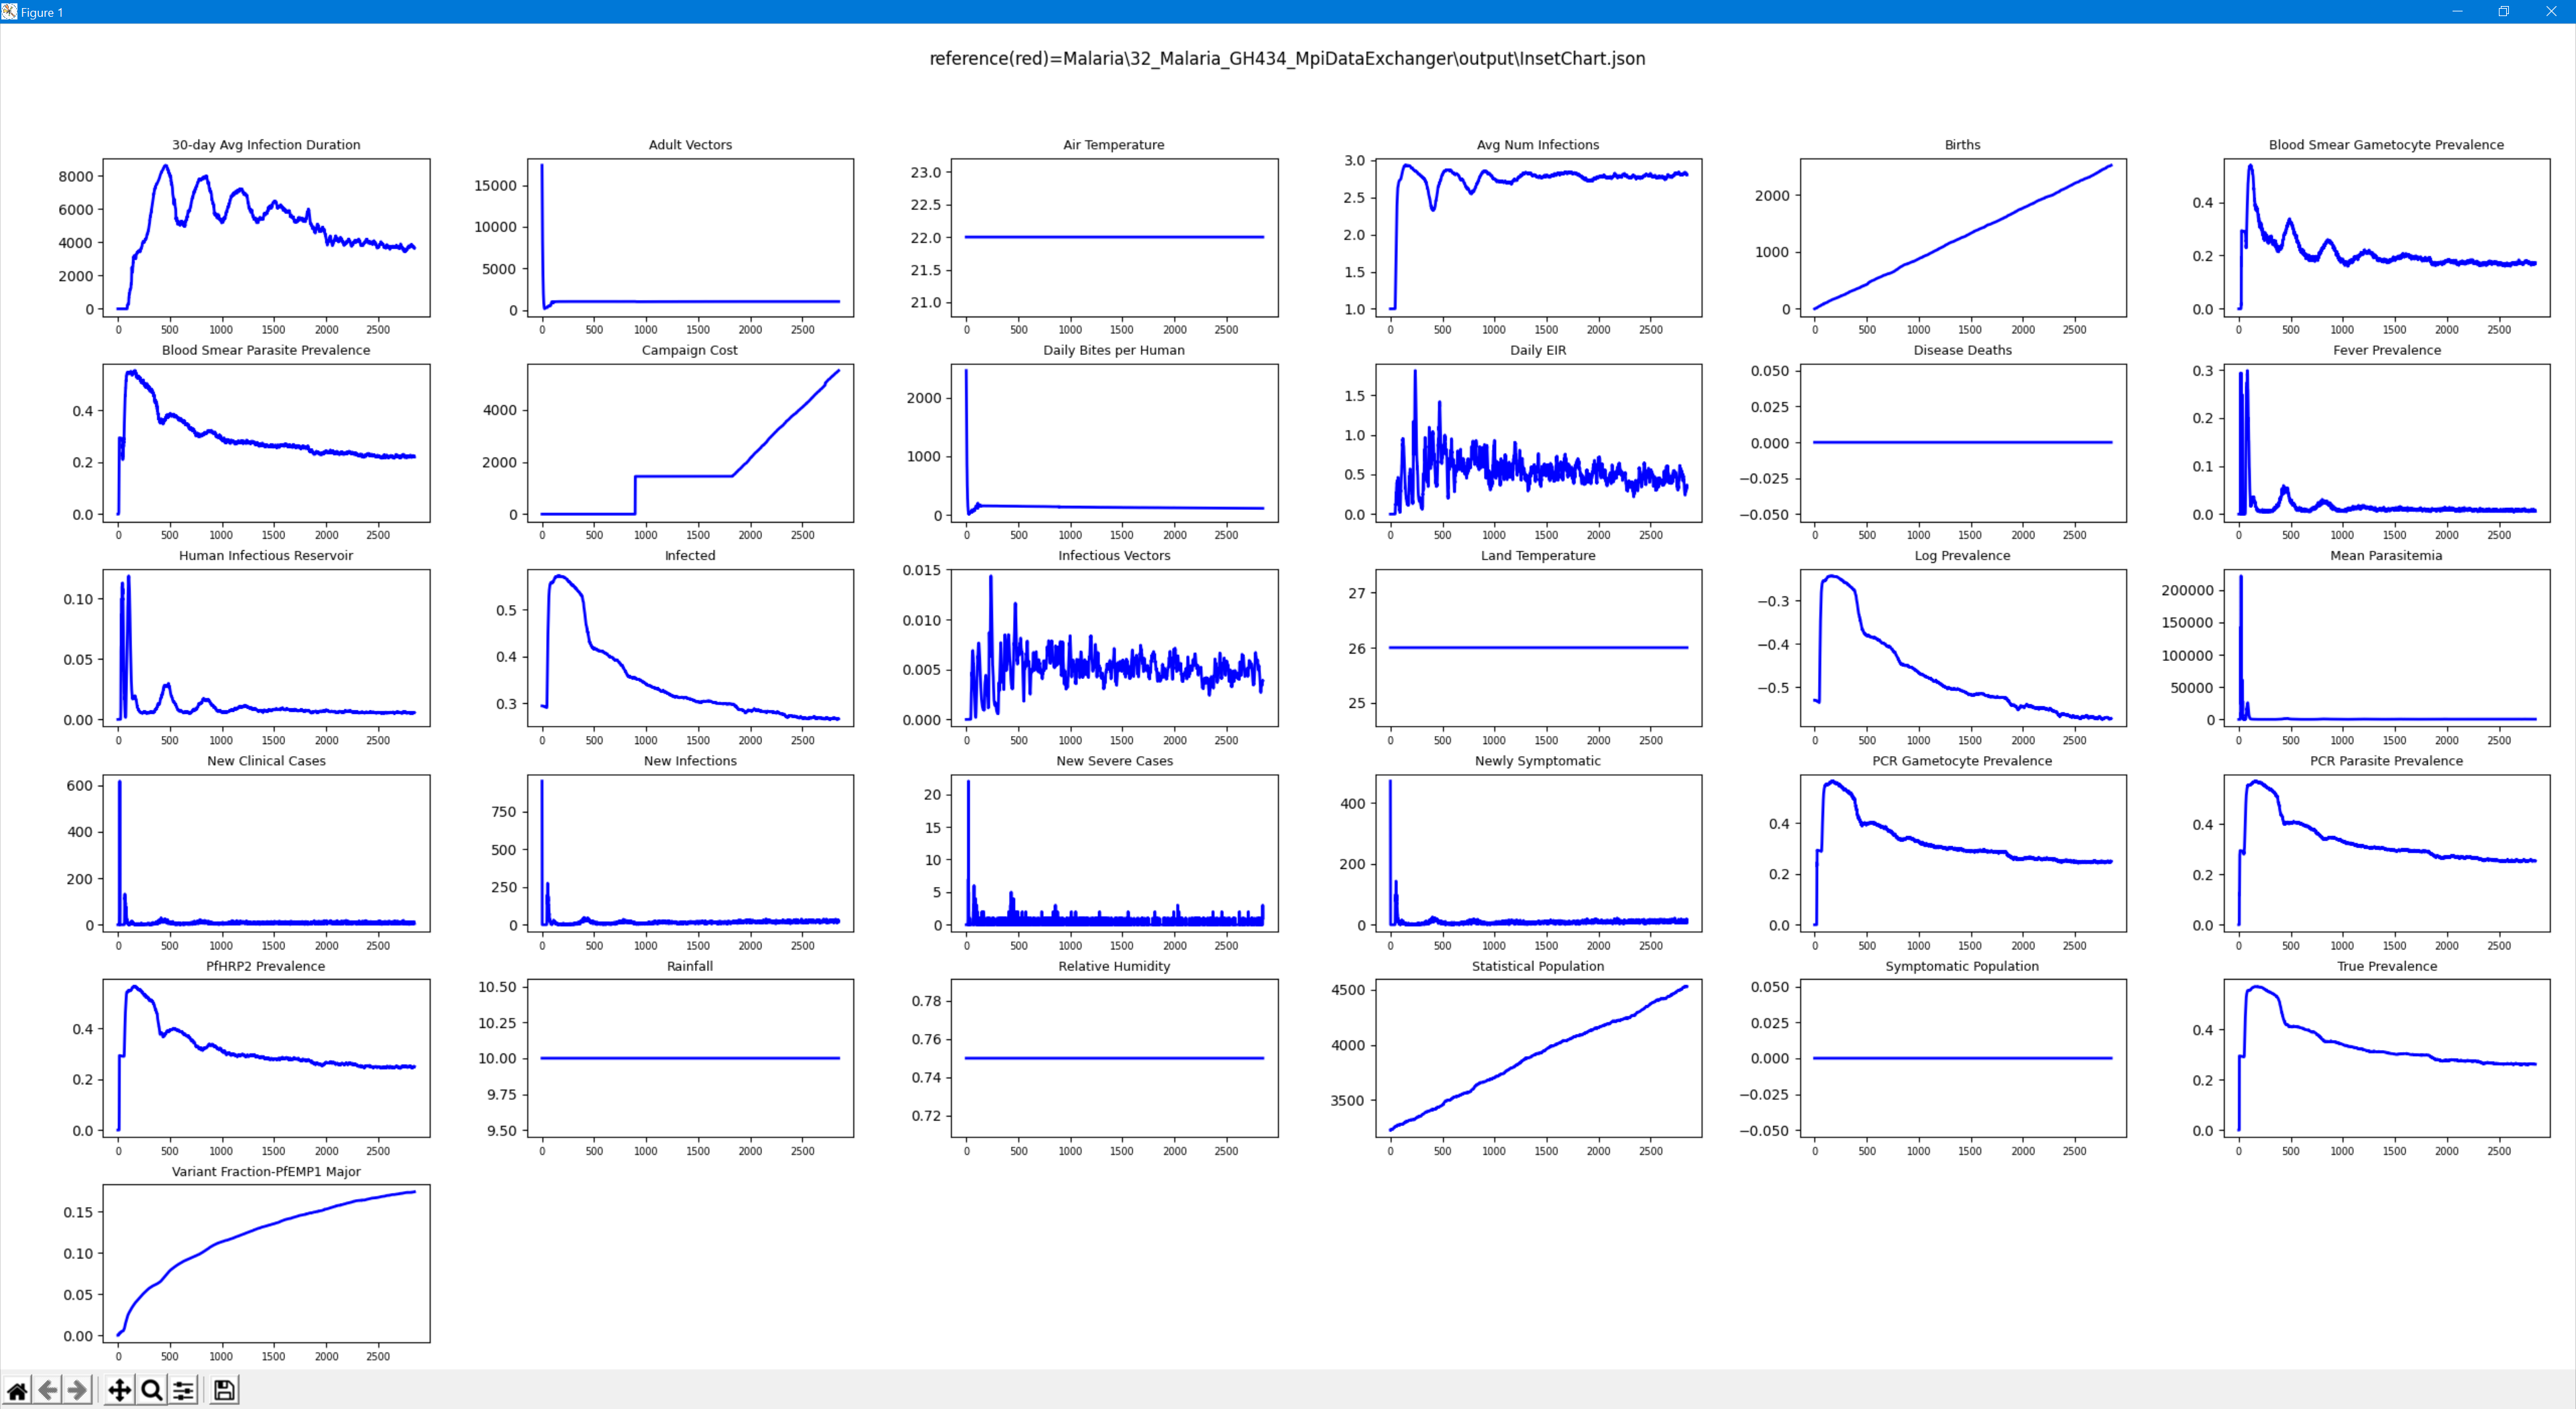
Example
The following is an example of a malaria-specific InsetChart.json:
{
    "Header": {
        "DateTime": "Thu Jun 10 07:01:07 2021",
        "DTK_Version": "0 unknown-branch (unknown) Jun  9 2021 11:19:20",
        "Report_Type": "InsetChart",
        "Report_Version": "3.2",
        "Start_Time": 0,
        "Simulation_Timestep": 1,
        "Timesteps": 2850,
        "Channels": 31
    },
    "Channels": {
        "30-day Avg Infection Duration": {
            "Units": "Days",
            "Data": [3729.955566406, 3697.680664063, 3650.832519531, 3629.385742188, 3646.3359375]
        },
        "Adult Vectors": {
            "Units": "Average Count/Node",
            "Data": [1027.041625977, 1027.176391602, 1027.213378906, 1026.593139648, 1026.565429688]
        },
        "Air Temperature": {
            "Units": "degrees Celsius",
            "Data": [22, 22, 22, 22, 22]
        },
        "Avg Num Infections": {
            "Units": "Count",
            "Data": [2.812913894653, 2.819536447525, 2.817204236984, 2.809917449951, 2.80363035202]
        },
        "Births": {
            "Units": "Count",
            "Data": [2515, 2515, 2517, 2520, 2521]
        },
        "Blood Smear Gametocyte Prevalence": {
            "Units": "Fraction Detected Infected",
            "Data": [0.1729622334242, 0.1707532554865, 0.1703867465258, 0.1688397824764, 0.1727031767368]
        },
        "Blood Smear Parasite Prevalence": {
            "Units": "Fraction Detected Infected",
            "Data": [0.2233267128468, 0.2217804342508, 0.223646402359, 0.2238674014807, 0.2206272035837]
        },
        "Campaign Cost": {
            "Units": "USD",
            "Data": [5486.75, 5488.75, 5490.75, 5494.75, 5498.75]
        },
        "Daily Bites per Human": {
            "Units": "Bites/Day/Human",
            "Data": [113.6352996826, 113.5904541016, 113.3630905151, 113.5420913696, 113.4094543457]
        },
        "Daily EIR": {
            "Units": "Infectious Bites/Day",
            "Data": [0.3297989964485, 0.3540976345539, 0.3334806859493, 0.3672928214073, 0.3440812528133]
        },
        "Disease Deaths": {
            "Units": "Count",
            "Data": [0, 0, 0, 0, 0]
        },
        "Fever Prevalence": {
            "Units": "Fraction Detected Infected",
            "Data": [0.008614976890385, 0.008614976890385, 0.008839778602123, 0.005966851022094, 0.005962897557765]
        },
        "Human Infectious Reservoir": {
            "Units": "Infectivity/Person",
            "Data": [0.005706539843231, 0.005738727282733, 0.005730483215302, 0.005793820600957, 0.005701572168618]
        },
        "Infected": {
            "Units": "Infected Fraction",
            "Data": [0.2666224837303, 0.2668433785439, 0.2669613361359, 0.2671823203564, 0.2672261595726]
        },
        "Infectious Vectors": {
            "Units": "Infectious Fraction",
            "Data": [0.00372875877656, 0.003818936413154, 0.003874097252265, 0.003857779549435, 0.003872038796544]
        },
        "Land Temperature": {
            "Units": "degrees Celsius",
            "Data": [26, 26, 26, 26, 26]
        },
        "Log Prevalence": {
            "Units": "Log Prevalence",
            "Data": [-0.5741032361984, -0.5737435817719, -0.5735516548157, -0.5731922984123, -0.5731210112572]
        },
        "Mean Parasitemia": {
            "Units": "Geo. mean parasites/microliter",
            "Data": [409.4178161621, 426.9133300781, 387.6334228516, 402.7696838379, 379.7192382813]
        },
        "New Clinical Cases": {
            "Units": "Count",
            "Data": [9, 13, 9, 7, 5]
        },
        "New Infections": {
            "Units": "Count",
            "Data": [32, 31, 25, 17, 21]
        },
        "New Severe Cases": {
            "Units": "Count",
            "Data": [ 0, 0, 0, 3, 1]
        },
        "Newly Symptomatic": {
            "Units": "Count",
            "Data": [19, 15, 16, 5, 11]
        },
        "PCR Gametocyte Prevalence": {
            "Units": "% Detected Infected",
            "Data": [0.2491716295481, 0.2476253658533, 0.2495027631521, 0.2466298341751, 0.2495582997799]
        },
        "PCR Parasite Prevalence": {
            "Units": "% Detected Infected",
            "Data": [0.2540313601494, 0.2529268860817, 0.2519336938858, 0.2514917254448, 0.2526501715183]
        },
        "PfHRP2 Prevalence": {
            "Units": "% Detected Infected",
            "Data": [0.248729839921, 0.2491716295481, 0.2481767982244, 0.2497237622738, 0.25]
        },
        "Rainfall": {
            "Units": "mm/day",
            "Data": [9.999994277954, 9.999994277954, 9.999994277954, 9.999994277954, 9.999994277954]
        },
        "Relative Humidity": {
            "Units": "",
            "Data": [0.75, 0.75, 0.75, 0.75, 0.75]
        },
        "Statistical Population": {
            "Units": "Population",
            "Data": [4527, 4527, 4525, 4525, 4528]
        },
        "Symptomatic Population": {
            "Units": "Count",
            "Data": [0, 0, 0, 0, 0]
        },
        "True Prevalence": {
            "Units": "% Detected Infected",
            "Data": [0.2622045576572, 0.2622045576572, 0.2618784606457, 0.2616574466228, 0.2617049515247]
        },
        "Variant Fraction-PfEMP1 Major": {
            "Units": "Fraction",
            "Data": [0.1735506355762, 0.1736092269421, 0.1737322509289, 0.1737831532955, 0.173709705472]
        }
    }
}