Vaccination and herd immunity
In a basic compartmental model, we often assume all individuals are susceptible before the importation of an outbreak. However, vaccination is one of the most effective ways to prevent or contain a disease outbreak.
Starting from the traditional SIR equation:
For an outbreak to start, the following condition needs to be satisfied:
If a vaccination campaign with coverage p \(\in\) [0, 1] is performed before the outbreak, a fraction of susceptible people move to the recovered compartment. If the vaccine take is e \(\in\) [0, 1], representing the probability of being protected after receiving a vaccine dose, the fraction of immune people due to vaccination is ep. Therefore, the previous condition can be reduced to:
Reff is also called the effective reproductive number. Vaccination can reduce the disease’s ability to spread, and the outbreak can be prevented or stopped with less than 100% coverage. When Reff= 1, there exists a minimum vaccination coverage that can prevent a disease outbreak. This minimum coverage required to prevent an outbreak is usually called herd immunity (represented as Pherd). Therefore, the analytical form of Pherd can be derived based on the previous condition:
Multiple rounds of vaccinations
If multiple vaccine interventions are performed in the same area, people are selected on a binomial basis and all individuals have the same probability of being included. If the vaccine coverage is p, every individual has a probability p of being selected in a given round. After the first round, the fraction of non-vaccinated is 1-p, and after n rounds this fraction is (1 - p)n. Therefore, the fraction of people getting at least 1 dose is:
For example, the fraction of people getting at least one vaccination with a 50% campaign coverage is shown in the following table. After a few rounds, the coverage increases significantly with the number of campaigns.
Number of campaigns |
Covered percentage (>=1 dose) |
|---|---|
1 |
50% |
2 |
75% |
3 |
87.5% |
4 |
93.75% |
5 |
96.875% |
For an example simulation, see the Generic/Vaccinations scenario in the downloadable EMOD scenarios zip file. Review the README files there for more information.
The following graphs show a baseline SIR outbreak and then the effect of a vaccination campaign distributed to the entire population. The vaccination campaign is repeated three times, seven days apart. The vaccine has 100% take and 50% demographic coverage. With this configuration, the fraction of immune people is above herd immunity and the outbreak does not spread.
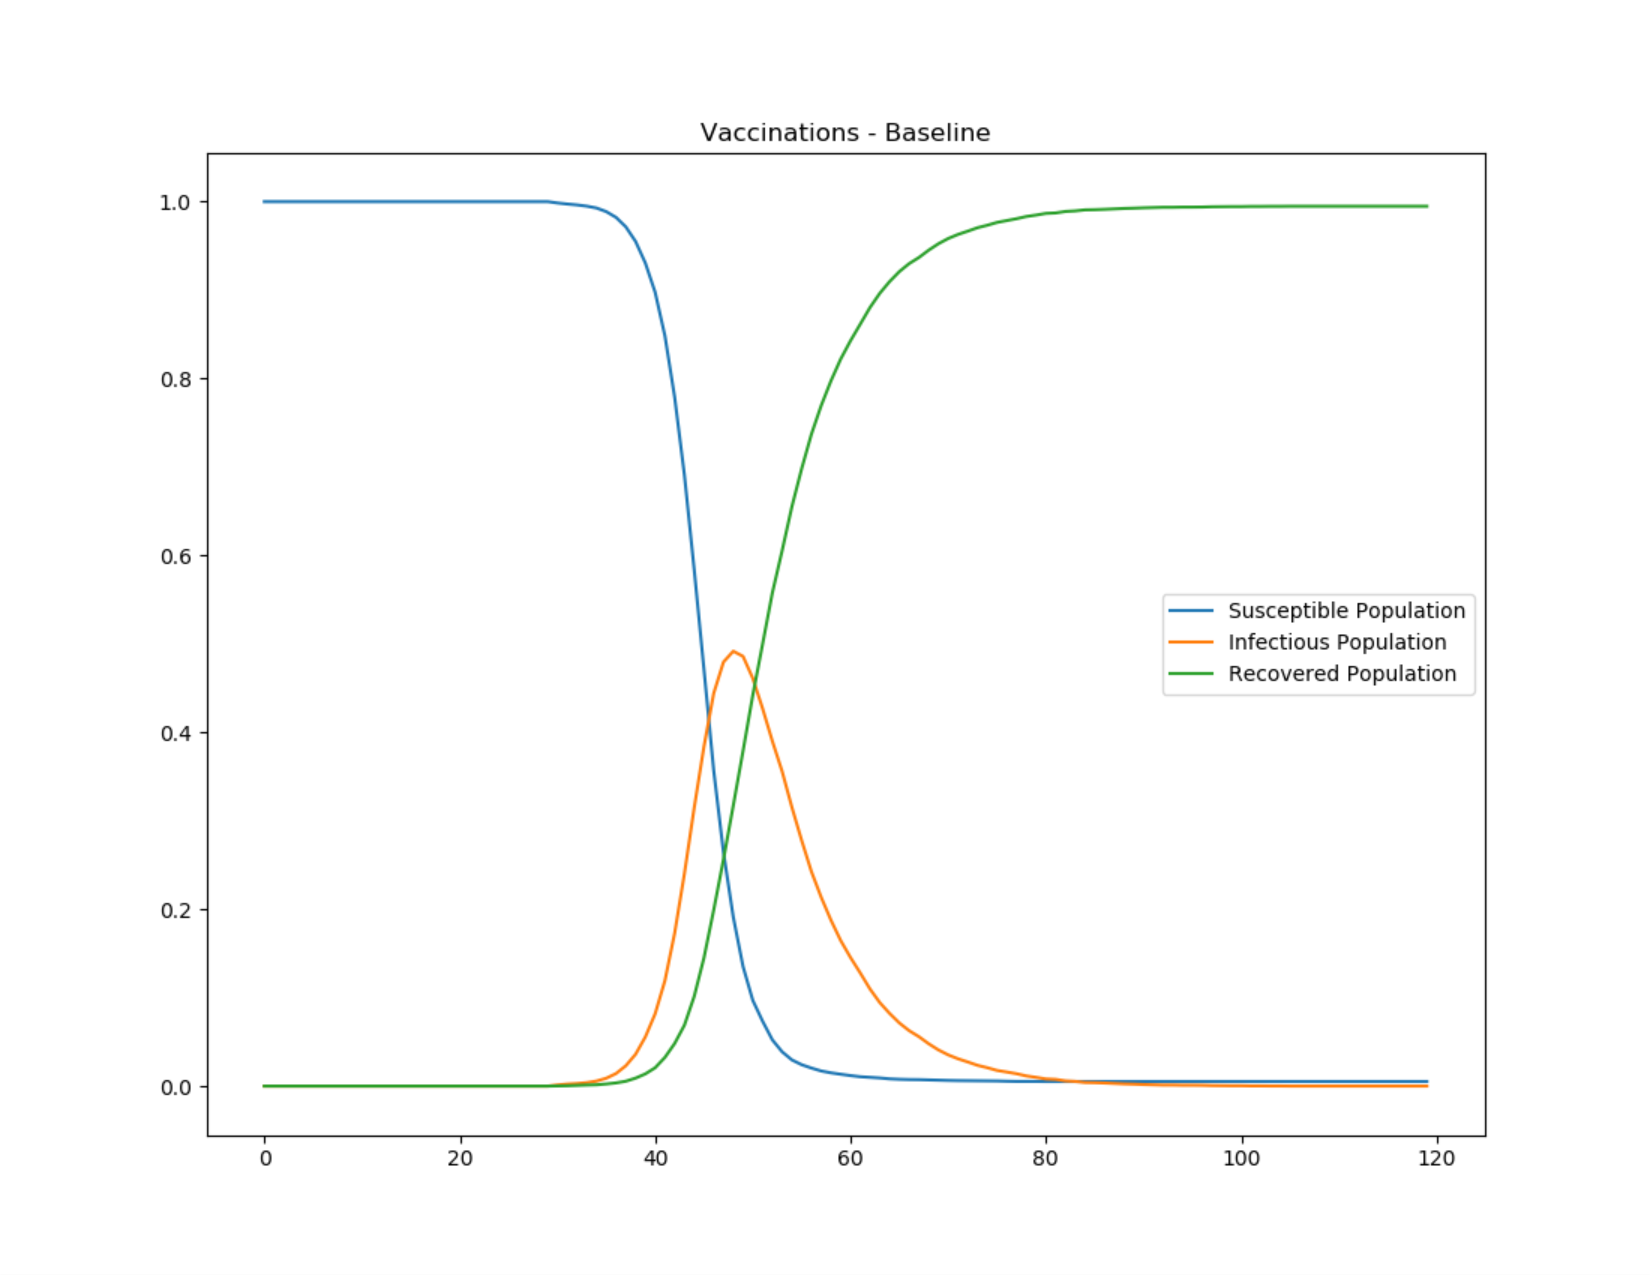
Figure 1: Baseline SIR outbreak
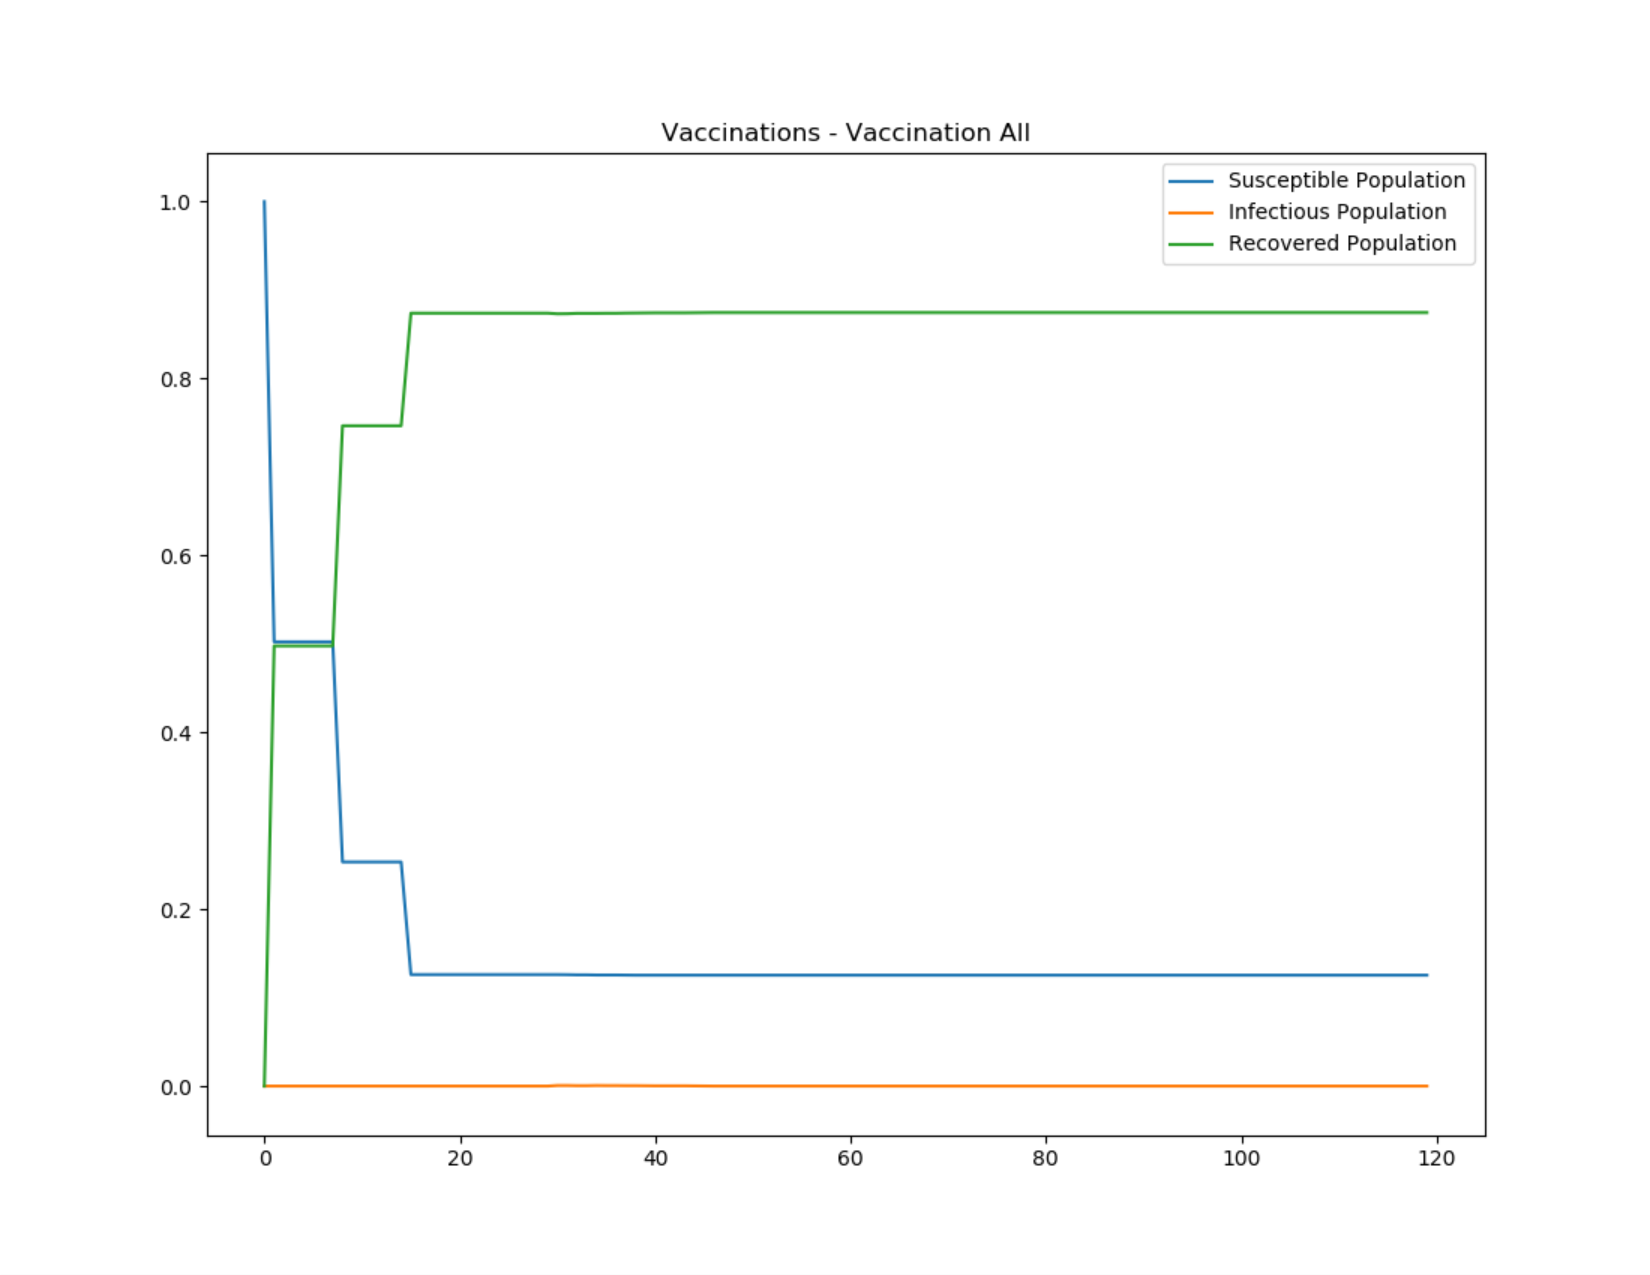
Figure 2: Broad vaccination campaign achieving herd immunity
However, this is usually not the case. In recent polio eradication campaigns, the number of supplemental immunization activity (SIA) campaigns planned in certain high-risk districts is greater than 6 per year, but poliovirus still persists in the area due to certain groups that are chronically missed. This can be caused by low accessibility, exclusion from SIA microplans, or vaccine refusal. Reff has not been driven below 1 because these susceptible people in the chronically missed groups are still in contact with the rest of population. In some modeling simulations, this assumption has to be included.
In this second example, the same 50% campaign coverage is repeated so that the same amount of vaccine is used. However, 30% of the population is not accessible to any vaccine campaigns. Although the number of vaccine doses used is the same as the previous example, the overall coverage is much lower. Creating campaigns that target interventions is described in more detail in Targeting interventions to nodes or individuals.
Number of campaigns |
Covered percentage of total population |
Covered percentage of groups with access |
Covered percentage of groups without access |
|---|---|---|---|
1 |
50% |
71.43% |
0% |
2 |
59% |
91.84% |
0% |
3 |
68.37% |
97.67% |
0% |
4 |
69.53% |
99.33% |
0% |
5 |
69.87% |
99.81% |
0% |
The following graph shows the same SIR outbreak when 30% of the population is chronically missed by the vaccination campaign, allowing the outbreak to persist.
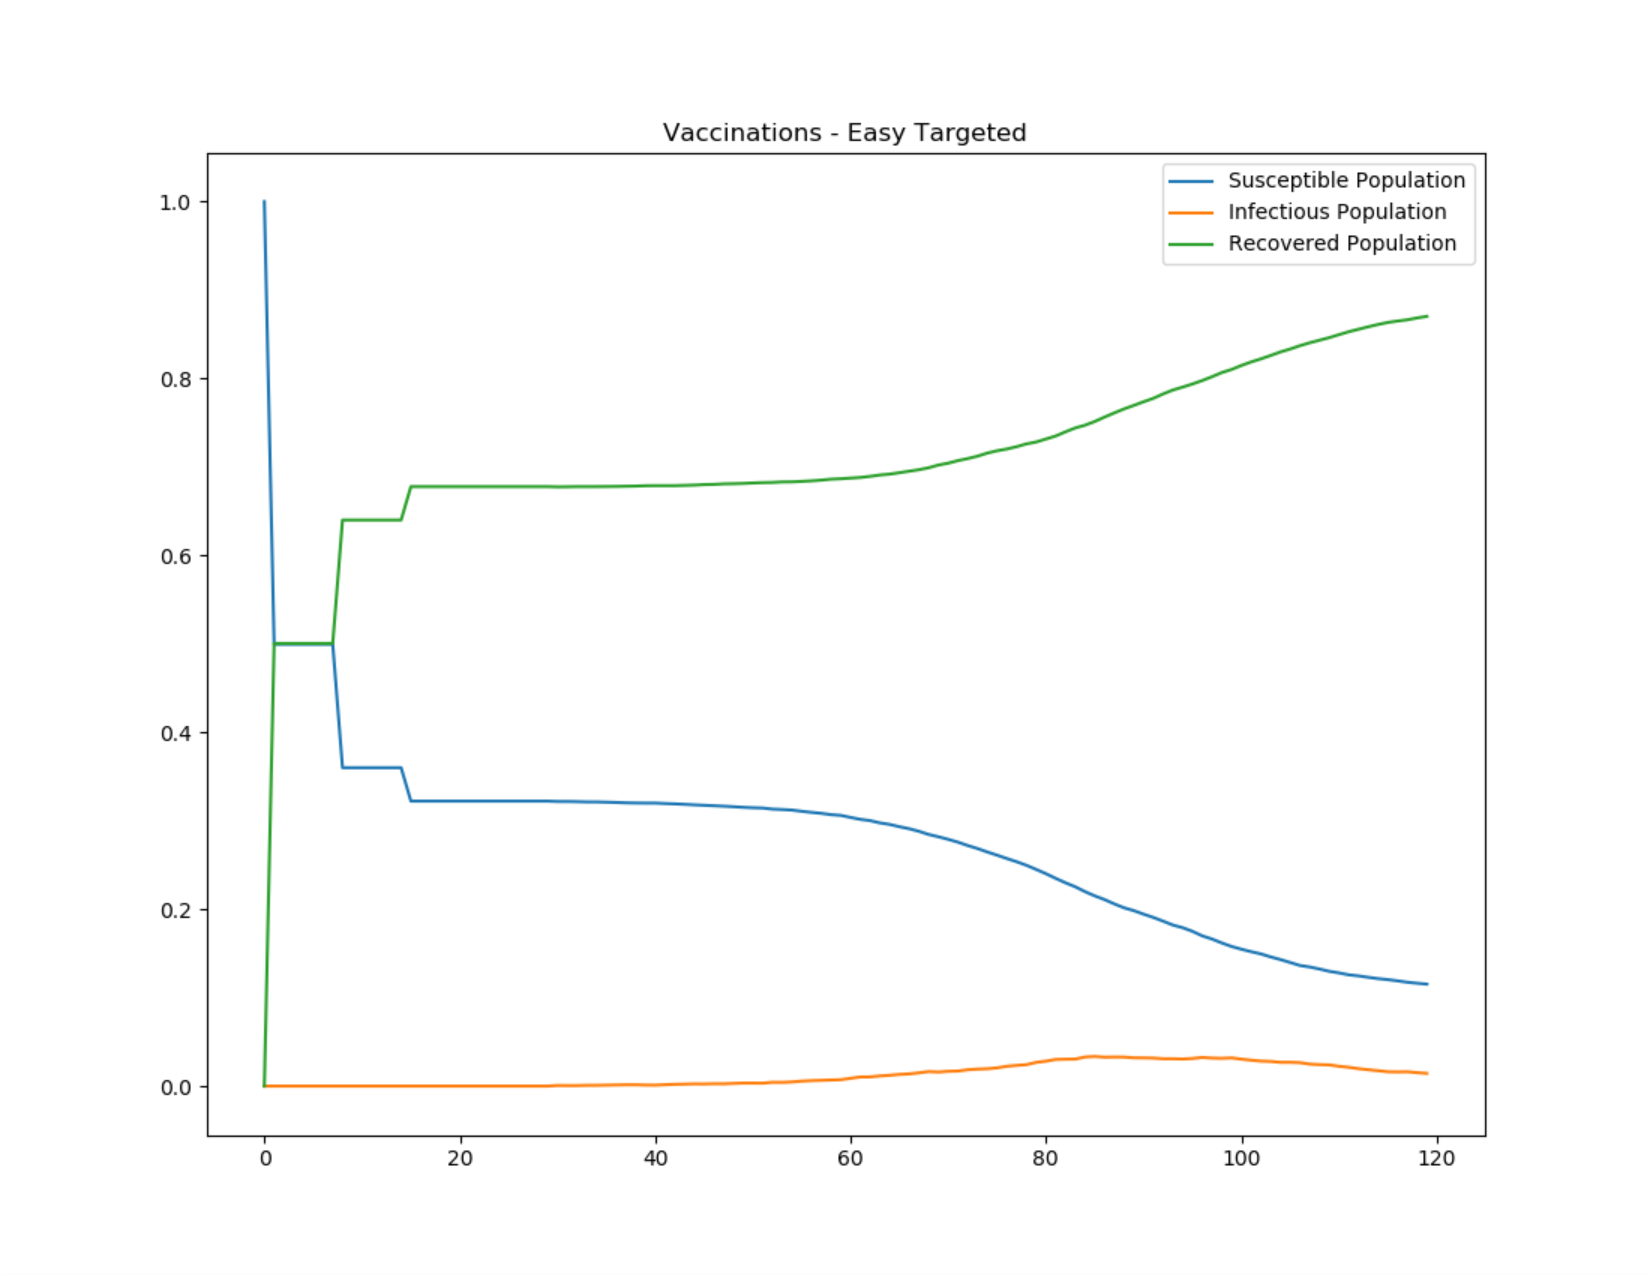
Figure 3: Vaccination campaign that misses 30% of the population