Seasonality
There is no climate data used in the EMOD environmental model; instead, seasonal effects on contagion levels are configured directly. As exposure to the environmental reservoir is known to vary seasonally, the levels of contagion in the environment can be modified via a trapezoidal-shaped infectivity multiplier. Seasonality is not constrained by the calendar year, and can start or end at any time (but there is a periodicity of 365 days). The pattern is anchored at the value specified by Environmental_Peak_Start, which indicates the day of the year peak seasonality begins. At the highest point in the season, individuals are exposed to 100% of the environmental reservoir. At low season, there is no dose through the environment, and all transmission is dependent on contact transmission.
The following figure illustrates the amplification and attenuation of the environmental contagion. Note that “seasonality_factor” represents the current value of the seasonality infectivity multiplier under seasonal forcing.
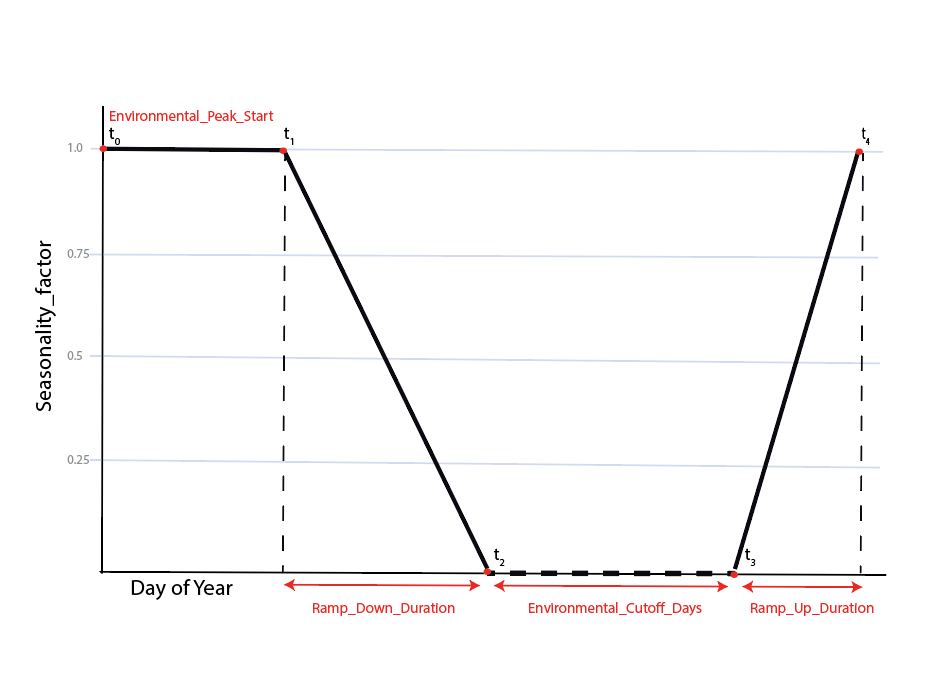
Fig. 1: Environmental amplification and attenuation as modified by seasonal_factor. A linear decrease (attenuation) occurs between t1 and t2 with seasonal_factors ranging from 1 to 0 and with slope determined by Environmental_Ramp_Down_Duration. Day of year is anchored at Environmental_Peak_Start, which here is set to 0. A linear increase (amplification) occurs between t3 and t4 with seasonal factors ranging from 0 to 1 and slope determined by Environmental_Ramp_Up_Duration.
Seasonality follows a trapezoidal shape with the following parameters:
Environmental_Peak_Start (t0 on Fig. 1)
Environmental_Ramp_Down_Duration (t1 to t2 on Fig. 1)
Environmental_Cutoff_Days (t2 to t3 on Fig. 1)
Environmental_Ramp_Up_Duration (t3 to t4 on Fig. 1)
Note
The sum total of all durations will be < 365.
Specific days of the year act as transition points:
Seasonal_factor max. Seasonal_factor remains at 1 (from t0 to t1 on Fig. 1)
Seasonal_factor remains at 1 for the number of days determined by: #Days = 365 – Environmental_Ramp_Down_Duration - Environmental_Cutoff_Days – Environmental_Ramp_Up_Duration
Seasonal_factor decrease. Seasonal_factor linearly decreases with each day from 1 to 0 (from t1 to t2 on Fig. 1).
A linear decrease occurs between seasonal_factor 1 and 0 with slope determined by Environmental_Ramp_Down_Duration.
Seasonal_factor min. Seasonal_factor remains at 0 (from t2 to t3 on Fig. 1).
Seasonal_factor remains at 0 for the duration of Environmental_Cutoff_Days.
Seasonal_factor increase. Seasonal_factor linearly increases with each day from 0 - 1 (from t3 to t4 on Fig. 1).
A linear increase occurs between seasonal_factor 0 and 1 with slope determined by Environmental_Ramp_Up_Duration.
Note
These numbers restart into subsequent years at day 365.
The shape of the trapezoid that forms the relationship of environmental amplification and attenuation is configurable. In the above plot, Environmental_Peak_Start is equal to 0, so Seasonal_factor is at the maximum value of 1 at day 0 (or January 1). However, Environmental_Peak_Start is a configurable parameter, and does not need to start at 0. The value set for this parameter will determine the position of the plot. The shape of the resulting ‘trapezoid’ is determined by the three duration parameters, Environmental_Ramp_Down_Duration, Environmental_Cutoff_Days, and Environmental_Ramp_Up_Duration. Depending on the values, the plot may start at Day 0 partway through the Environmental_Ramp_Up_Duration. The below plot demonstrates an example:
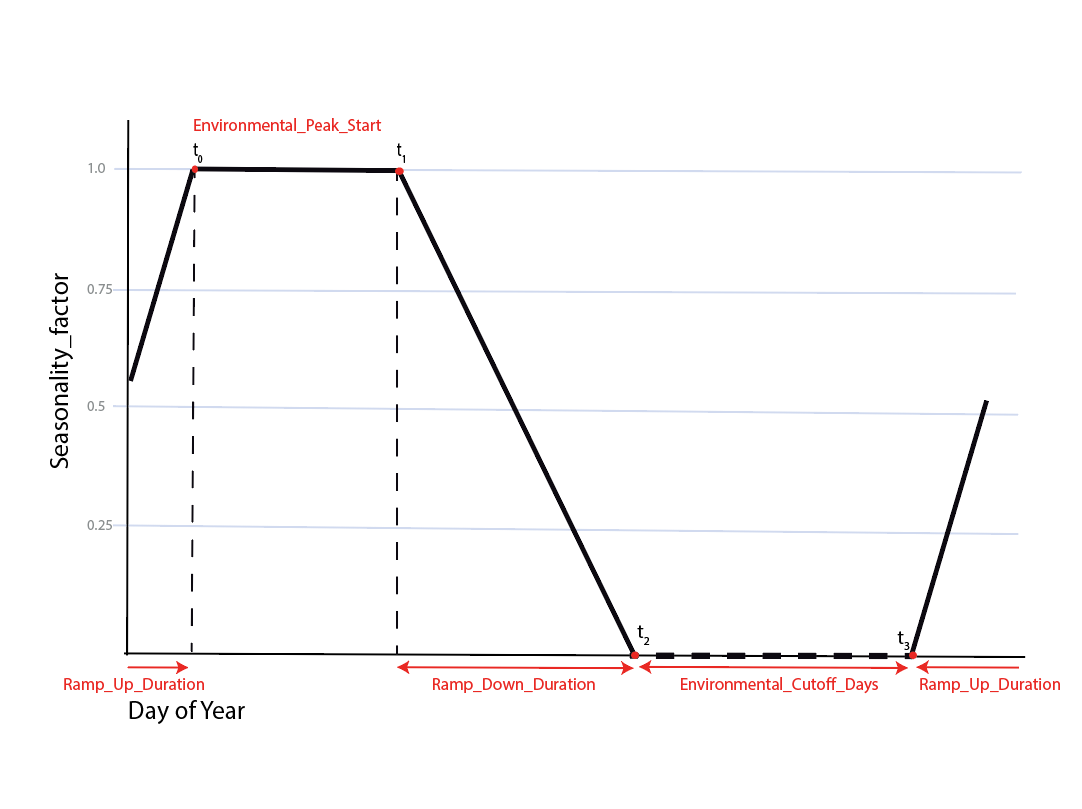
Fig. 2: Environmental amplification and attenuation as modified by seasonal_factor. Here, day of year is anchored at Environmental_Peak_Start =/= 0. For comparison, t0 still represents the Environmental_Peak_Start, and t0 - t1 still represents the duration at max Seasonality_factor. Environmental_Ramp_Down_Duration still occurs from t1 - t2, and Environmental_Cutoff_Days occurs from t2 - t3. However, notice now that Environmental_Ramp_Up_Duration is split: it starts midway through the ramp up at Day 0, and by Day 365 it is “finishing” the ramp up.