Health care systems#
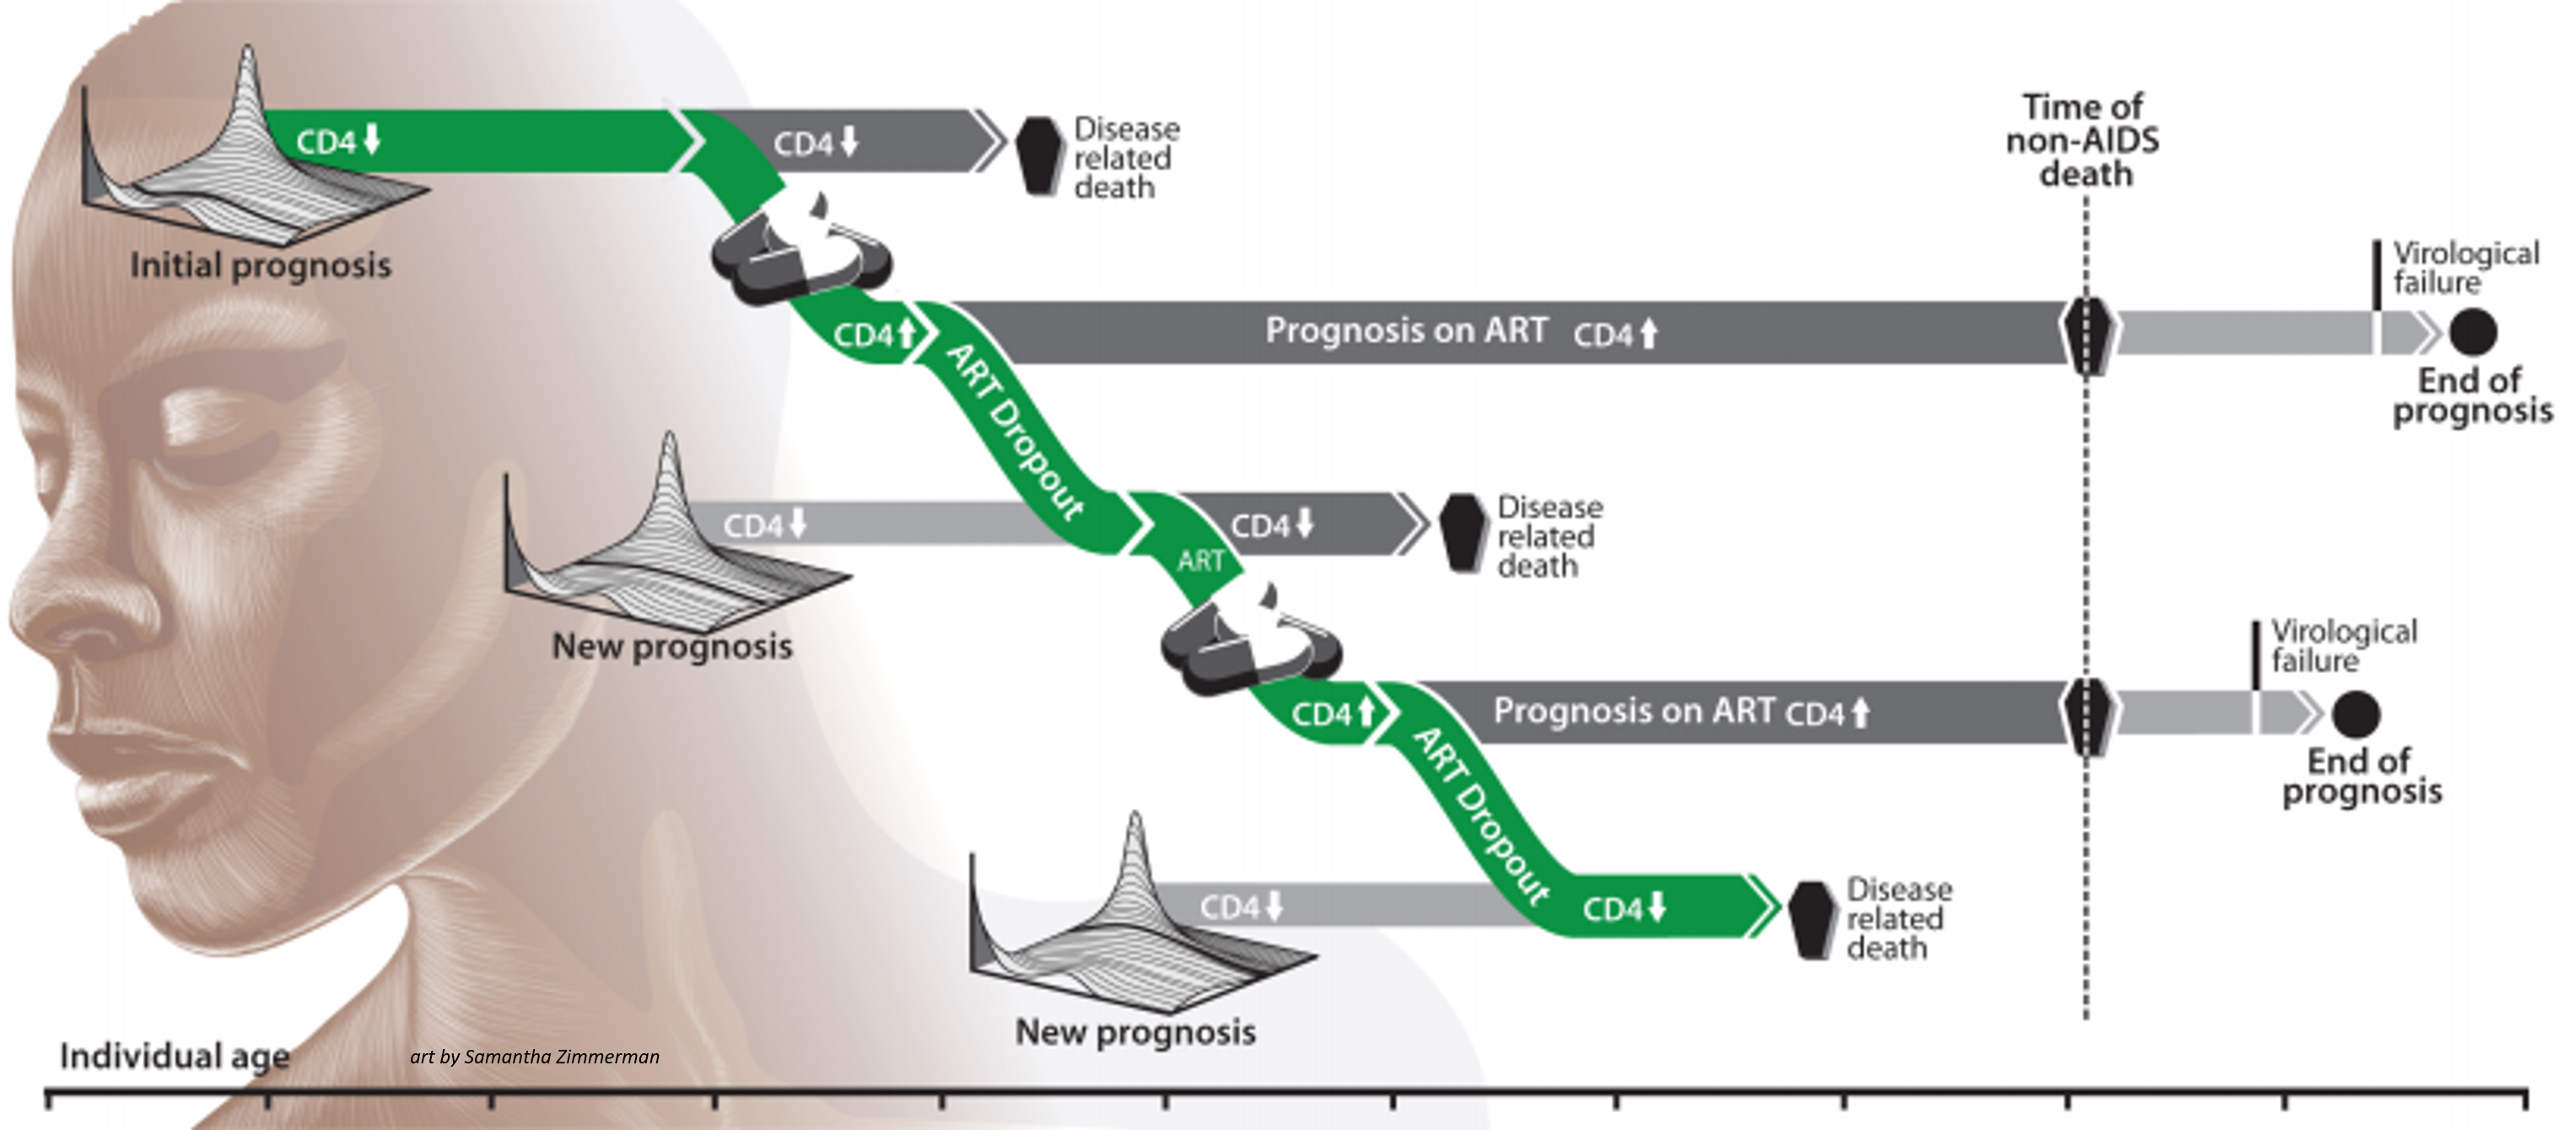
Intervention campaigns in the EMOD HIV model typically involve health care, treatment, and access to care. Configuring campaigns involves the use of event coordinators, which determine who will receive the intervention; campaign events, which determine when and where interventions will be distributed; and the intervention itself, which determines what will be distributed. For HIV, these events and interventions can be configured to create a health care system, such that individuals with particular attributes are selected for particular types of care. For HIV, this system is termed the cascade of care, and involves testing, diagnosis, and treatment; individuals can leave and enter the cascade at multiple time points.
For more information on the cascade of care, see Cascade of care.
Restricting multiple entries into health care#
Health care in EMOD is bi-directional: it can be applied to individuals, or it can sought by individuals in response to various triggering events including birth, sexual debut, pregnancy, or AIDS symptoms. A potential problem created by this structure is that an individual could end up in care multiple times. For example, an individual might have an antenatal care (ANC) visit and, in the same time-step, seek health care for AIDS symptoms, both leading to HIV testing and staging.
The HIVMuxer intervention is a method that can be used to prevent this problem. HIVMuxer counts the number of times an individual is simultaneously waiting in the same delay state or group of delay states and restricts the number of entries that individual is eligible to receive.
Diagnostics and testing#
To route individuals into the care and treatment systems, it is necessary to use diagnostic testing. EMOD has multiple types of diagnostics, which can be found in Campaign parameters. The outcomes of different diagnostic tests can be used to initiate treatment, prevention services, entrance into health care systems, or lead to knowledge (such as HIV status) that will change the individual’s behavior. Testing can be triggered by a variety of factors, such as age, time of sexual debut, onset of symptoms, pregnancy, or simply through voluntary/routine testing. The triggers can be configured in the different types of diagnostics, and different results can be used to initiate care. Tests also have a probability of being wrong, such that some individuals that test negative may in fact be positive for the disease.
Decisions#
Individuals can be enrolled in treatment due to the outcomes of diagnostic testing, but EMOD also allows for individuals to make decisions about treatment. These decisions can be based on factors such as time, age, the individual’s current state or sexual debut status, or even a random choice.
For individuals making a random choice, EMOD will base the decision on a random coin flip, or if more than 2 choices are configured in the campaign file, a dice roll. All choices and their outcome probabilities are configurable; should the sum of the probabilities not equal 1, then EMOD will normalize the sum to 1, while keeping their relative proportions the same.
The HIVRandomChoice class allows you to configure an array of options and the probabilities for each outcome. In those cases, the probabilities are not dependent on the number of choices, but must still sum to 1.
History of past treatment guidelines#
The results of diagnostic tests are used to route individuals to treatment, with target levels for CD4 counts, WHO stage, or other factors used to determine the course of action for the individual. Over the past several decades, such treatment guidelines have changed, and EMOD allows for these changes in guidelines to be incorporated into the diagnostics. For example, cut-off values for CD4 counts by age and pregnancy status to determine eligibility for treatment have expanded in South Africa over the past 20 years. Configuring InterpolatedValueMap (which consists of arrays of Times and Values) for their appropriate parameters will let the model utilize these different diagnostic levels in the appropriate years.
The below JSON (JavaScript Object Notation) example shows the HIVARTStagingCD4AgnosticDiagnostic intervention class, where several parameters demonstrate configuring past history guidelines. For example, Adult_By_WHO_Stage has different WHO stage category recommendations for ART eligibility depending on year, and Child_Treat_Under_Age_In_Years_Threshold shows how the age at which children were eligible for ART changed over time.
{
    "class": "CampaignEvent",
    "Event_Name": "OnART1-triggered piecewise event",
    "Start_Day": 1,

    "Nodeset_Config": {
        "class": "NodeSetAll"
    },

    "Event_Coordinator_Config": {
        "class": "StandardInterventionDistributionEventCoordinator",
        "Event_Name": "DrawBlood constant test, broadcasts HIVPositiveHIVTest",
        "Demographic_Coverage": 1,
        "Intervention_Config": {
            "class": "NodeLevelHealthTriggeredIV",
            "Trigger_Condition_List": ["HIVNeedsHIVTest"],

            "Demographic_Coverage": 1,
            "Duration": 14600,

            "Actual_IndividualIntervention_Config": {
                "class": "HIVARTStagingCD4AgnosticDiagnostic",
                "Positive_Diagnosis_Event": "HIVPositiveHIVTest",
                "Base_Specificity": 0,
                "Base_Sensitivity": 0,
                "Cost_To_Consumer": 10,
                "Days_To_Diagnosis": 5,
                "Disqualifying_Properties": ["InterventionStatus:InterventionStatus_1", "InterventionStatus:InterventionStatus_2", "InterventionStatus:InterventionStatus_3"],
                "New_Property_Value": "InterventionStatus:InterventionStatus_4",
                "Individual_Property_Active_TB_Key": "HasActiveTB",
                "Individual_Property_Active_TB_Value": "YES",
                "Adult_Treatment_Age": 1865,
                "Adult_By_WHO_Stage": {
                    "Times": [
                        1990, 1995, 2000, 2005
                    ],
                    "Values": [
                        4.1, 2, 3, 4
                    ]
                },
                "Adult_By_TB": {
                    "Times": [
                        1990, 1995, 2000, 2005
                    ],
                    "Values": [
                        0, 1, 1, 1
                    ]
                },
                "Adult_By_Pregnant": {
                    "Times": [
                        1990, 1995, 2000, 2005
                    ],
                    "Values": [
                        1, 1, 1, 0
                    ]
                },
                "Child_Treat_Under_Age_In_Years_Threshold": {
                    "Times": [
                        1990, 1995, 2000, 2005
                    ],
                    "Values": [
                        1, 2, 5, 3.2
                    ]
                },
                "Child_By_WHO_Stage": {
                    "Times": [
                        1990, 1995, 2000, 2005
                    ],
                    "Values": [
                        1.1, 1.5, 2, 2.5
                    ]
                },
                "Child_By_TB": {
                    "Times": [
                        1990, 1995, 2000, 2005
                    ],
                    "Values": [
                        1, 1, 1, 0
                    ]
                }
            }
        }
    }
}
Pre-exposure prophylaxis#
Antiretroviral therapy as treatment for HIV was explained above, in Antiretroviral therapy (ART). ART can also be used as pre-exposure prophylaxis (PrEP), to prevent the transmission of HIV. In EMOD, the ART interventions are only used for treatment for HIV+ individuals, so to use ART as a prophylactic, it is treated as a “vaccine” and the vaccine intervention classes are used.
Citations#
May M, Boulle A, Phiri S, et al. Prognosis of patients with HIV-1 infection starting antiretroviral therapy in sub-Saharan Africa: a collaborative analysis of scale-up programmes. The Lancet 2010; 376:449–457

