HIV model overview#
The EMOD HIV model is an agent-based stochastic simulator of sexual and vertical HIV transmission. It is used to simulate HIV conditions for national-level epidemics in order to evaluate the cost and impact of various treatment and control programs. The model utilizes microsolvers to combine detailed information on human immunity, within-host viral dynamics, the effects of antiretroviral drugs, and other aspects of HIV virology to simulate HIV transmission. To use the HIV model, set the configuration parameter Simulation_Type to HIV_SIM.
HIV model framework#
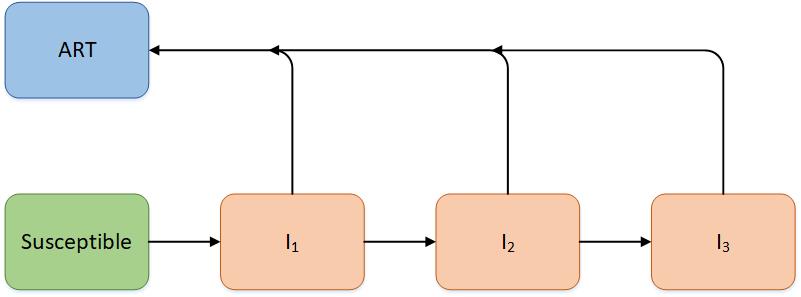
The most simplistic method of modeling HIV would be to use an SI compartmental model. Recall that in an SI model, individuals are born with no immunity; once becoming infectious, there is no resulting immunity gained from the disease and individuals remain in the infectious stage for life. Some HIV modelers increased the complexity of their compartmental models by using an SIR model, but modify the compartments by replacing “Recovered/Removed” with “AIDS,” thereby creating an “SIA” model [Ref29]. Another option for increasing the fit of compartmental models is to add multiple stages of I, allowing for differentiation of the stages of HIV progression. This also enables the addition of ART to the model, where individuals can enter ART at different rates, and then return to survival rates that are similar to HIV- individuals [Ref30].

While EMOD is an agent-based model, individuals move through the infectious states analogously to the compartmental models described above. To account for the real-world complexity of HIV transmission, numerous parameters have been added to EMOD to increase its predictive power. Further, these parameters and their associated microsolvers allow EMOD to model aspects of HIV infections and population dynamics that do not readily fit into the SI framework (for example, the complexities that arise due to relationships and human contact networks). Finally, as an agent- based model, EMOD enables the addition of spatial and temporal properties to the simulation.
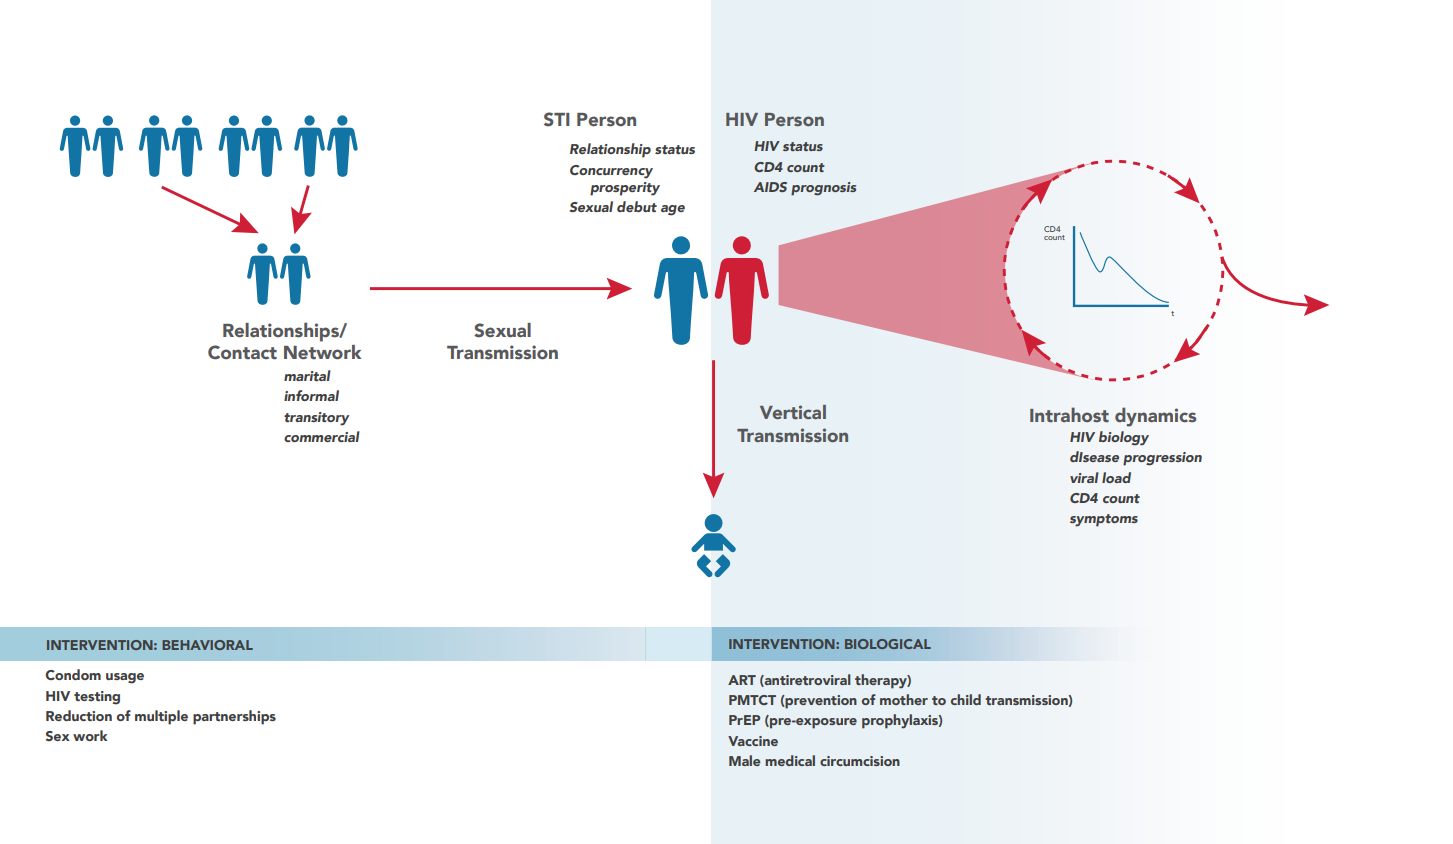
The following network diagram breaks down the model into various model components, and illustrates how they interact with one another. The components on the network diagram correspond to the structural components listed below. The following pages will describe in detail the general model functionality and how the structural components function.

Network diagram illustrating the HIV model and its constituent components.#
The HIV simulation type adds a layer of HIV-specific biology to the general STI framework, which includes co- factors and interventions affecting transmission, as well as disease progression on and off therapy.
Cascade of care#
By using campaign interventions and the appropriate event coordinator, it is possible to configure retention along a care continuum to model how individuals progress with detailed time-linked variables associated with access to care. For more information on configuring a cascade of care, see Cascade of care. For configuring HIV-specific treatment guidelines and cascades of care, such as participation in ART programs and associated drop-out rates, see Health care systems.
Individuals are guided through care cascades using individual properties, a very flexible and powerful feature of the model. With this feature, it is possible for you to create a set of tags for individuals in order to target them for events such as specific interventions, types of care, or even having a specific risk level. For more information on how individual properties, see Individual and node properties.
Model output and reporters#
EMOD supports numerous methods for viewing simulation output. By default, every simulation creates an output report of aggregated data (see Overview of EMOD software for more information). While EMOD enables the creation of custom reports, the HIV model has an extensive list of available built-in reports. The reports are enabled in the config.json file (see Output settings for a complete list) and provide information on aspects of relationships and pair formation, infection status (including CD4 counts, WHO stage, and start and stop years), ART status, demographics, mortality, and other pertinent information. Note that it is important to keep track of which reports are enabled when running simulations, as some output files may not be desirable or appropriate with the simulation configuration. For example, Report_HIV_Infection creates a .csv file which logs the state of each individual at each time- step, so as the population grows or the simulation duration increases, this file will become extremely large and simulations can take much longer to complete.
The following pages describe the structure of the model and explore the model components. Additionally, the specifics of the model are discussed in detail in the articles Bershteyn, Klein, Wenger, and Eckhoff, arXiv.org, and Klein, Bershteyn, and Eckhoff, AIDS 2014.
Citations#
Jun-jie, et al, 2010. Dynamic mathematical models of HIV/AIDS transmission in China. Chin Med J. 123(15): 2120-2127. https://www.ncbi.nlm.nih.gov/pmc/articles/PMC5523934/
Williams. 2014. Fitting and projecting HIV epidemics: Data, structure, and parsimony. https://arxiv.org/ftp/arxiv/papers/1412/1412.2788.pdf
