Intrahost dynamics and HIV biology
The EMOD HIV model adds within-host HIV biology to the transmission modality of the STI person- to-person contact network. This allows the production of HIV-specific transmission rates, mortality rates, and the progression of biomarkers (such as CD4 count) specific to HIV-infected individuals. These factors can vary according to individual-specific traits, such as age, disease state, co- infection status, use of antiretroviral therapy, or other attributes.
The following sections describe how the model functions for untreated HIV. Treatment, such as health care and continuous enrollment on ART will alter the survival rates, and will be described in HIV intervention information.
Disease progression
The EMOD HIV model uses three stages of untreated HIV infection: acute, latent, and AIDS. The durations of acute and AIDS are configurable in the config.json file. The total survival time with HIV is sampled stochastically based on the individual’s age at the time of infection, and the duration of the latent stage is the total survival time minus the duration of the acute and AIDS stages. If the total survival time is shorter than the sum of the acute and AIDS stages, then the latent stage is eliminated and the AIDS stage is shortened as needed; in rare cases when survival is shorter than the acute stage, the remaining acute stage is shortened to fit within the survival duration and there is no AIDS stage.
Survival with untreated HIV infection
HIV prognosis is both heterogeneous and highly age-dependent, so survival is sampled from an age-dependent Weibull distribution, shown below.
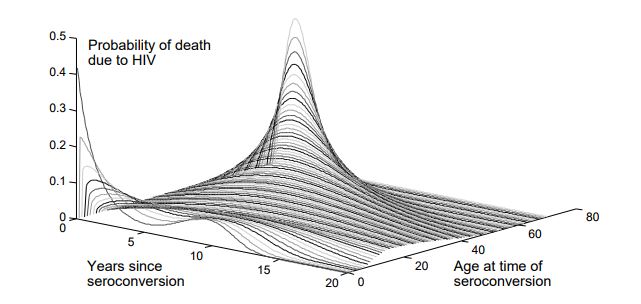
Age-dependent survival distribution for untreated HIV; figure reprinted from Bershteyn et al 2013.
Survival times for untreated HIV are determined at the time of infection using the above age- dependent distribution. There are different parameters used to configure the age distributions for children vs. adults, and the age at which an individual should no longer follow the children’s distribution can also be configured. The survival distribution for children is a convex combination of two Weibull distributions, to capture the bimodal nature of survival in children (children can be categorized as “rapid” or “slow” progressors). To configure this distribution, it is necessary to determine the fraction of children in each category, the decay rate of survival for rapid progressors, and the Weibull parameters for the slow progressors. For adults, the survival time is Weibull distributed, with older individuals having a shorter average survival time. These parameters are configured in the config.json file.
CD4 count
CD4+ T cells are immune system cells that fight off infection (see HIV disease overview for more information). Measuring the count of CD4 cells is a method to gage how well the immune system is functioning, or for HIV, to measure the progression of the disease. In the EMOD HIV model, CD4 count is initialized at a value that is selected from a Weibull distribution. During an untreated HIV infection, CD4 declines such that the square root of the count varies linearly between a starting point (the “post infection” point) and the count at death. This assumption of decline does not include the rapid and complex dynamics of CD4 counts during early HIV infection and during late-stage AIDS.
The survival time for untreated infection corresponds to the duration required for the change in CD4 count from initiation to end, and is used to determine the slope for declining CD4. However, some individuals may later initiate ART and survive longer than the time used to compute the slope.
The heterogeneity in CD4 count can be configured for the starting and ending counts; see Configuration parameters for more information. Because CD4 counts are Weibull-distributed parameters, the scale and heterogeneity can be configured. The scale parameters set the post- infection and at-death values, while the heterogeneity parameters are the inverse of the Weibull shape. Setting the heterogeneity to small values is equivalent to large shape parameters, and will result in a sharp peak near the scale value. Setting heterogeneity to zero will cause the initial CD4 count to be equal to the post-infection scale value.
WHO stage
The WHO has created clinical staging definitions to define and track the stages of HIV progression. Each WHO stage advances from 1 - 4 with transition times sampled from a Weibull distribution and is associated with declining bodyweight. In EMOD, both CD4 count and the current WHO stage influence the individual’s survival, although the WHO stage is not a configurable parameter. Note that WHO stage will determine eligibility for ART interventions; see HIV intervention information for more information.
WHO stage is assumed to progress in proportion to an individual’s assigned survival time, but has added randomness to account for variability in HIV symptoms (and resulting ART eligibility) over a range of CD4 counts. Following a model by Johnson et al [Ref31], progression across WHO stage categories is divided into Weibull-distributed durations over the interval of survival, using the Weibull parameters tabulated below:
WHO stage transition |
Shape |
Scale |
|---|---|---|
1 to 2 |
0.9664 |
0.26596 |
2 to 3 |
0.9916 |
0.19729 |
3 to 4 |
0.9356 |
0.34721 |
The WHO stage is generally considered an integer of 1, 2, 3, or 4. To provide additional information about how close an individual is to advancing to the next WHO stage, EMOD interpolates between transitions. For example, if an individual advances from WHO stage 1 to WHO stage 2 over the course of 100 days, the WHO stage on the 90th day will be 1.9. To obtain the expected integer value of WHO stage, the output should be rounded down. To examine WHO stage (and CD4 count) over time, it is possible to log each individual’s infection status with output reports. See HIV model general information for more information.
Symptomatic presentation
Survival with HIV is highly dependent on receiving proper treatment with ART. Unfortunately, HIV symptoms typically are not diagnostic until the individual has reached the AIDS stage, which makes survival probability low. In EMOD, the model independently draws the time at which an individual may present for care due to AIDS-related symptoms. The time between symptomatic presentation and (untreated) AIDS-related death is assumed to be Weibull-distributed, and these parameters can be configured in the config.json file (see the “mortality and survival” section of Configuration parameters for more information).
Upon infection or ART discontinuation, the individuals draw from the configured Weibull distribution to determine the time between symptomatic presentation and untreated AIDS-related death. The duration is subtracted from the AIDS-related death date to determine the time of symptomatic presentation. Small values lead to symptomatic presentation close to the time of AIDS-related death, and large values lead to symptomatic presentation well before AIDS- related death. If the drawn time is longer than the total survival time, then the total survival time is used (i.e., symptomatic presentation occurs immediately upon infection). The date of symptomatic presentation has no direct impact on clinical progression; however, it can be used to configure health-seeking behavior.