HIV model general information
EMOD is a modeling framework that supports multiple modes of disease transmission. For information on how the modeling software works and the files required to use the software, see Overview of EMOD software. To model HIV, an STI transmission mode is used. This framework enables person-to-person transmission through a network of relationships or contact networks, each of which has a specific transmitter and recipient of every transmission event. To organize the networks, individuals form one or more relationships that are remembered over time.
Preference for partners is configurable through the model’s input files. Inside the model, the “supply and demand” for types of partners is balanced by a pair formation algorithm (PFA) that, if desired, can dynamically adjust the rates of relationship formation in each demographic category to produce a constant mixing pattern, even with demographic changes in the population. Alternatively, the dynamic adjustments can be turned off to allow mixing patterns to change in response to demographic changes. For more information on the PFA, see Relationships and contact networks.
The HIV simulation type adds a layer of HIV-specific biology to the general STI framework, which includes co- factors and interventions affecting transmission, as well as disease progression on and off therapy. Further, using campaign interventions and the appropriate event coordinator, it is possible to configure retention along a care continuum to model how individuals progress with detailed time-linked variables associated with access to care. For more information on treatment and care, see Cascade of care.
Model functionality
The EMOD HIV model propagates forward in time using a combination of discrete events and time steps. This allows for one or more function calls to be scheduled for execution at a future time in the simulation.
As with all the EMOD disease models, the HIV model utilizes object-oriented programming design principles such as interfaces, factories, and observers to achieve a highly modular architecture, thus enabling comparisons of structural assumptions and different levels of model detail. For example, parameters specific to the intrahost biology of disease progression and to behavioral propensities that drive pair formation have been separated into different inheritance classes. Thus, modules or sub-modules can be interchanged while leaving other portions of the model intact.
Because the HIV model is built around person-to-person contact networks, human relationships impact nearly every aspect of model functionality. For example, migration is supported in the HIV model, but is more complicated than in other disease types, as now it impacts the relationships experienced by the migrating individual (see Relationships and contact networks for more information).
HIV demographics
Built-in demographics options are available for running EMOD simulations, or the user can create customized demographics files to represent particular locations. However, for the HIV model, it is recommended to create a demographics file instead of using built-in demographics. The majority of parameters that control the human contact networks and their resulting interactions are configured in the demographics file.
Every individual within the simulation has a variety of properties, represented by continuous or discrete state variables. Some properties are static throughout life, and others dynamically change through the course of the simulation, through response either to aging or to simulation events (such as infection). Included in these properties are complex dynamic objects for HIV infection and relationships. Static properties are assigned upon instantiation (simulation initialization or birth after the beginning of the simulation) and include gender, time of birth, time of non-HIV death, STI co-infection, and male circumcision. Dynamic properties include HIV status, history of ART program participation and drop-out if applicable, and relationship participation. Some examples are listed below; to see the complete list of demographics parameters, see Demographics parameters.
Vital dynamics
Vital dynamics within the EMOD HIV model are derived from fertility and mortality tables that are passed to the model as input. Input demographic data can be used to construct a cumulative probability distribution function (CDF) of death date based on individuals’ birth dates. Then, in the model, individual agents will be sampled stochastically from this CDF using an inverse transform of this distribution. Female agents similarly sample the age at next childbirth, if any, upon instantiation and birth of a previous child. Pregnancy is not linked to relationship status, although newly born individuals are linked to a mother. The fertility rate changes by simulation year and female age, and the range for available estimates depends on input data. Values outside of this range can be chosen by “clamping,” or choosing the nearest value within the range. Clamping was also used when necessary to determine the non-AIDS mortality rate, which varies by gender, age, and simulation year.
Society parameters
The contact networks formed within the HIV model are driven by the behavioral parameters found in the Society section of the demographics file. These parameters control pair formation, relationship types, and level of relationship concurrency. For more information about how contact networks work, see Relationships and contact networks.
IndividualProperties
One very flexible and powerful feature of the model is a feature known as IndividualProperties (see Individual and node properties for more information). With this feature, it is possible for the user to create a set of tags for individuals in order to target them for events such as specific interventions, types of care, or even having a specific risk level. IndividualProperties is also used to tag individuals for campaign decisions or to create a cycle of care (such as their participation in ART programs and associated drop-out rates). For more information on this Cascade of Care, see Cascade of care.
Time-course
The time-course of a simulation run is depicted graphically below. In general, simulations begin prior to the start of infection, (in the example, the year 1960) to allow ample time for relationships to “burn-in.” During this burn-in time, individuals with demographic properties dictated in the demographics file begin forming relationships; relationship formation rates for each gender and relationship type are updated daily using the relationship flow algorithm (see Relationships and contact networks for more information). Adjustment of pair formation entry rates is terminated at a specific timepoint (in the example, at 1975) and the rates are fixed at that value for the remainder of the simulation.
Next, a timepoint is selected to see infections (1980 in the example). The seeding process infects a configured percentage of the population, as determined by data and configured in a campaign file (see Outbreak for more information).
The last portion to configure is the introduction of treatment. Here, the ART intervention is enabled in the year 2012. Eligible individuals enroll in ART as determined in the campaign file. ART distribution continues for the duration specified, which here is the remainder of the simulation which runs until 2050.
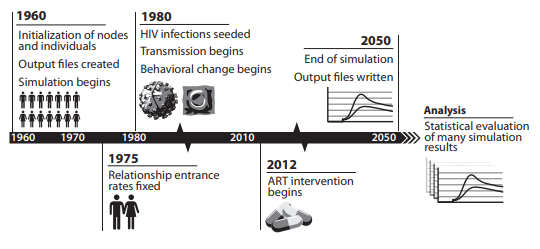
An example time-course of an EMOD simulation, originally published in Bershteyn et al. 2012, arXiv.
Model output and reporters
EMOD supports numerous methods for viewing simulation output. By default, every simulation creates an output report of aggregated data (see Output files for more information). While EMOD enables the creation of custom reports, the HIV model has an extensive list of available built-in reports. The reports are enabled in the config.json file (see the “Output” section of Configuration parameters for a complete list) and provide information on aspects of relationships and pair formation, infection status (including CD4 counts, WHO stage, and start and stop years), ART status, demographics, mortality, and other pertinent information. Note that it is important to keep track of which reports are enabled when running simulations, as some output files may not be desirable or appropriate with the simulation configuration. For example, Report_HIV_Infection creates a .csv file which logs the state of each individual at each time- step, so as the population grows or the simulation duration increases, this file will become extremely large and simulations can take much longer to complete.