Case finding and cascade of care
The disease progression of tuberculosis can be slow and involve multiple interventions over a long period of time. Therefore, EMOD provides the ability to structure a campaign file to guide individuals through a complex cascade of care.
EMOD provides the flexibility to do this in a number of ways. One option is to use the InterventionStatus individual property to assign new property values when an intervention is received, guiding individuals through a health care system based on the property values assigned to them. Another option is to use trigger interventions when certain events occur. You may use either strategy or a combination of the two when configuring the cascade of care for your simulation.
In the demographics file, you can define any number of property values that are then assigned to individuals in the simulation. When an individual receives an intervention, you can use the New_Property_Value parameter to assign a new value to them. You can then target interventions to individuals with certain property values using Property_Restrictions_Within_Node and prevent others from receiving it using Disqualifying_Properties. AntiTBDrug also easily enables you to distribute different drugs based on assigned property values.
For example, individuals may be initialized with a TreatmentNaive value, which is changed to SputumTest after receiving a test, to TestPositive after receiving the results, to CDCFirstLine when receiving medication, and so on. For more information on how to configure a cascade of care using this option, see Cascade of care. To view more information on configuring properties, see NodeProperties and IndividualProperties.
When using event triggers, EMOD has many built-in events available (see Event list) and you can also create custom events. The following diagram shows the events that occur as individuals transition from one disease state to another.
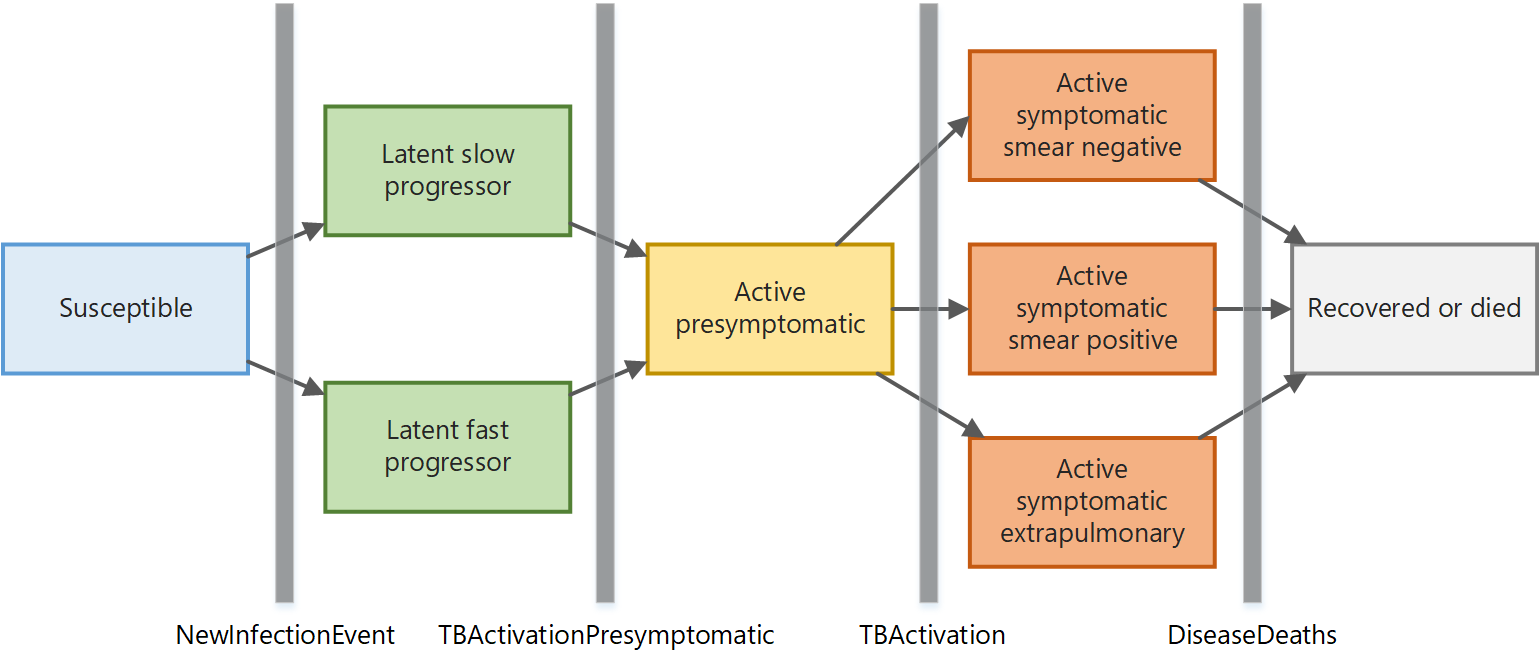
Figure 1: Events of TB disease progression
Events can also mark specific steps in the care cascade, such as ProviderOrdersTBTest when an individual visits a health care provider. Detailed reporting within the cascade of care can add insight into why patients ultimately do or do not receive curative treatment.
The following sections walk through an example of configuring a cascade of care using event triggers for passive case finding and active case finding. In passive case finding, symptomatic individuals must present themselves to health care providers, who subsequently order a TB test. Individuals must return to get their test results before they can receive treatment. In active case finding, people who failed treatment or never returned for their test results are brought back to the clinic for a second provider visit. This scenario also uses individual properties to produce output using the Property output report. To run these simulations yourself, see the TB/Cascade_Of_Care scenario in the downloadable EMODScenarios folder. Review the README files there for more information.
The following diagram shows how the cascade of care is parameterized in EMOD. The orange boxes represent events that occur and the blue ovals represent interventions in the EMOD campaign file. The parameters and events used by the model are in parentheses.
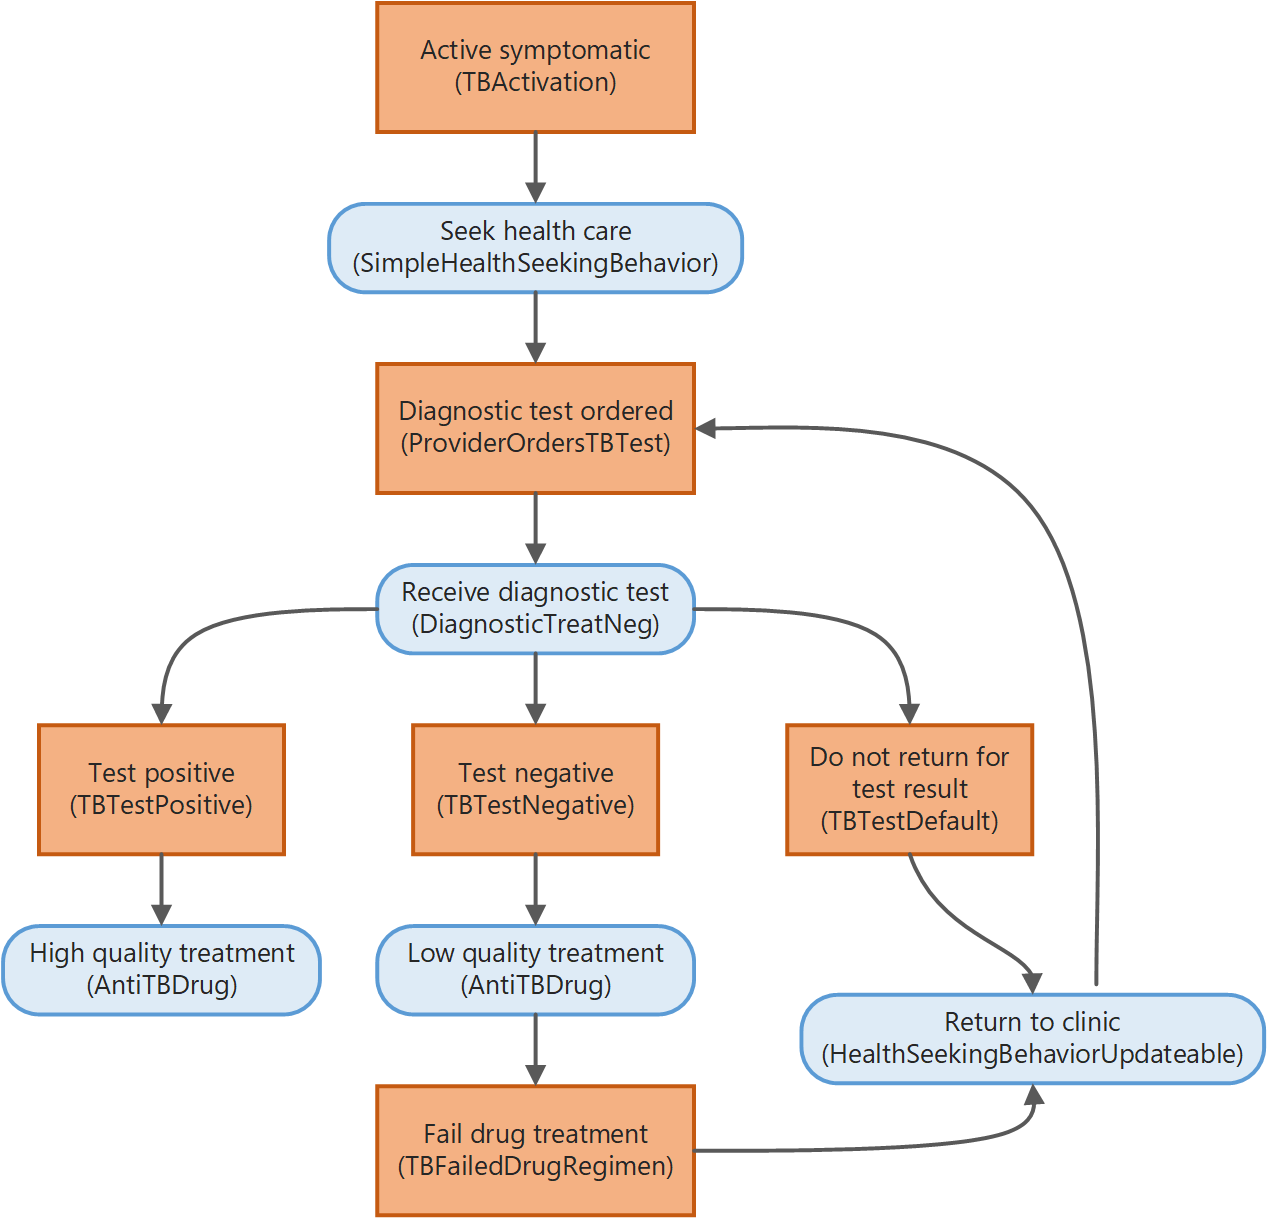
Figure 2: Cascade of care for passive and active case finding
Passive case finding
This scenario illustrates a simple cascade of care that represents symptomatic individuals who present themselves to providers. As most individuals do not immediately seek treatment for symptoms, this models “health seeking behavior” where individuals present to health care provides at an exponential rate after TB activation. For more information, see SimpleHealthSeekingBehavior.
Once they visit the provider, they receive a diagnostic test for TB. For more information, see DiagnosticTreatNeg. Some individuals may not return to get their test result (defaulters), which can occur for various reasons, including lack of trust in the provider or lack of time and funds to make a second trip to this provider. Individuals who do return to get their test result may receive either a positive or negative test result. If the TB test is positive, providers may order higher quality treatment, which in this illustration, is highly effective against TB.
If the TB test is negative, providers may order empiric treatment, which in this illustration is not effective against TB. At the close of their treatment, patients would continue to be symptomatic and again re-seek treatment. However, in the passive case finding scenario, the rate of health seeking is very low (controlled by the parameter Tendency) so individuals who default or fail treatment are effectively lost to treatment. For more information, see SimpleHealthSeekingBehavior.
The property report graphs below show the number of TB infections, include breaking out active TB and smear-positive TB. The difference between the number of infections and the number of active infections is the number of latent infections; the difference between the number of active infections and the number of active smear-positive infections is the number of smear-negative infections. (Note that this simulation uses a 5 day time step, so day 5 is the time step 1.)
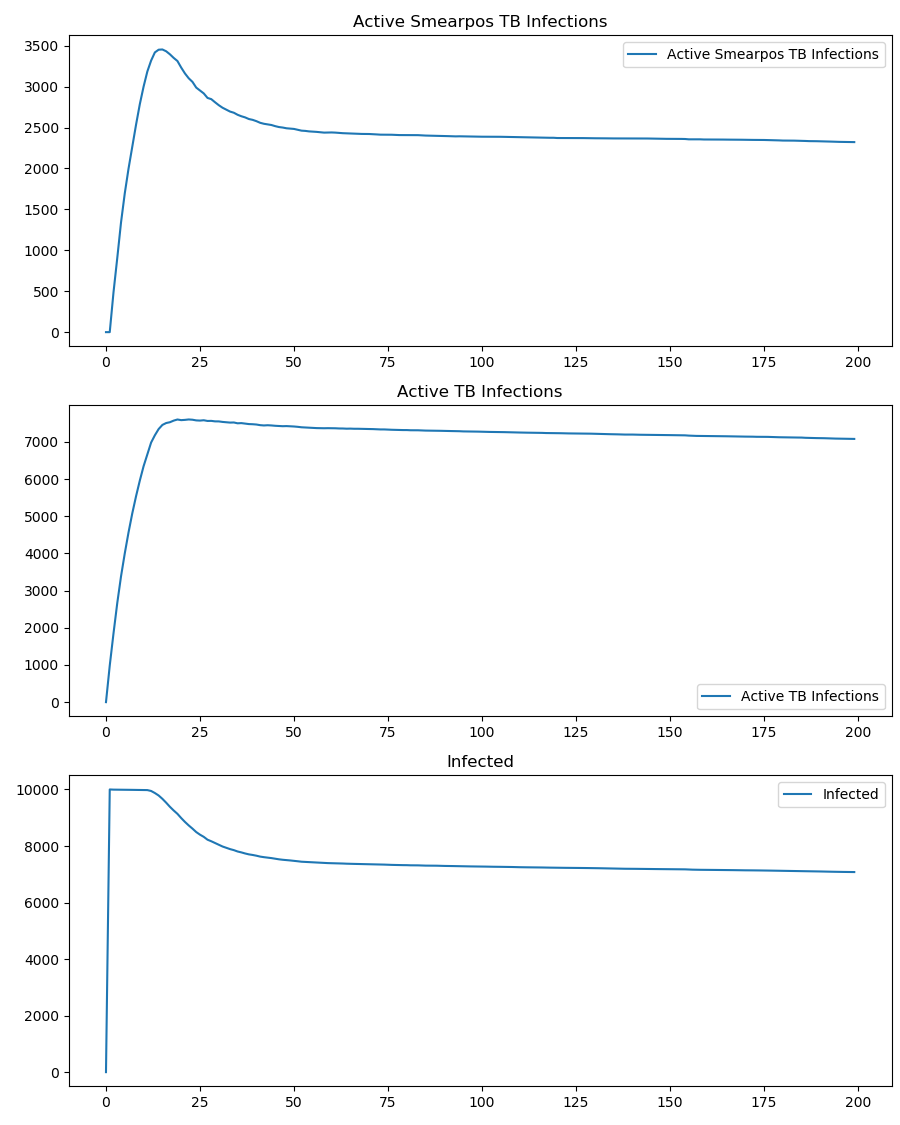
Figure 3: Infections with the passive case finding strategy
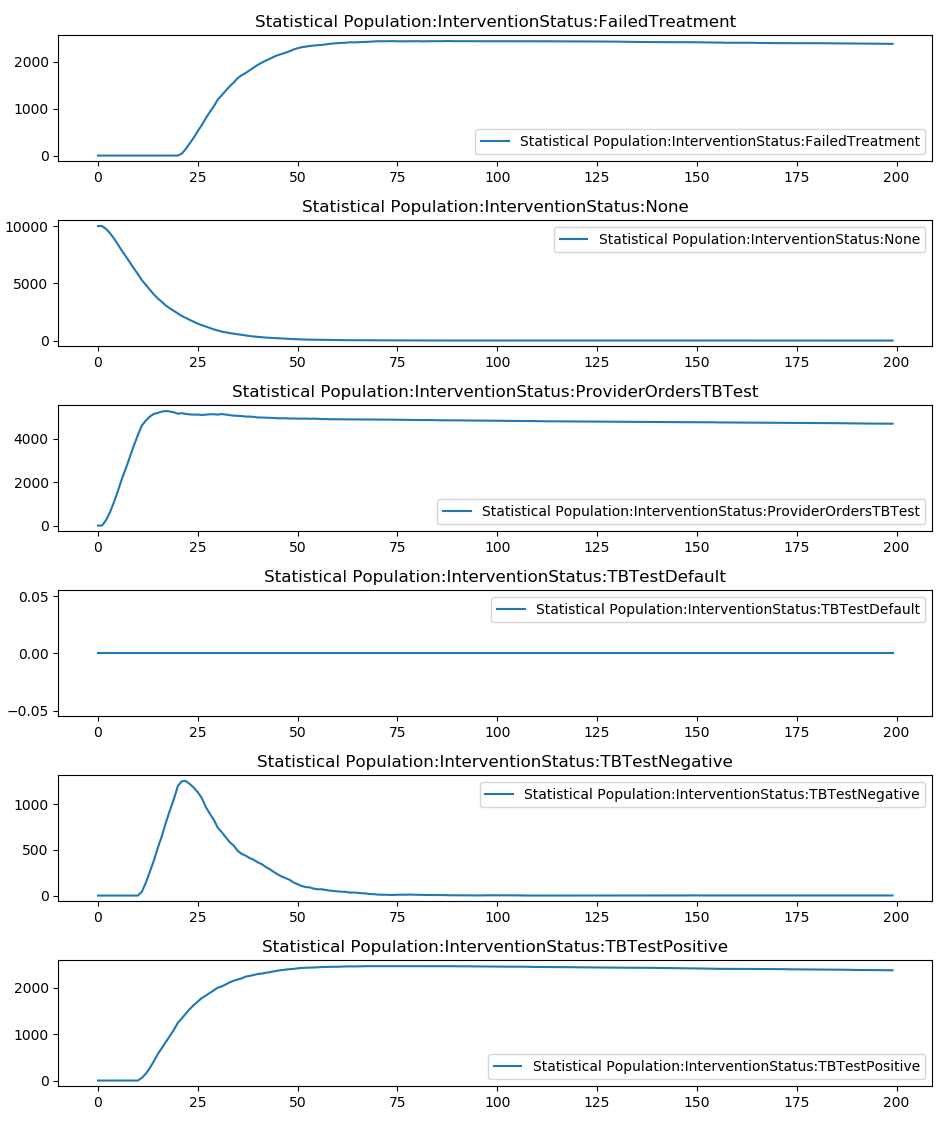
Figure 4: Population of each group in the care cascade
Active case finding
The active case finding scenario is configured almost identically. However, at day 500 it updates the tendency of individuals who defaulted or failed treatment to seek out health care to 1. This simulates finding all such individuals and bringing them into the clinic for treatment. (Note that this simulation uses a 5 day time step, so day 500 is the time step 100.)
The property report graphs below show the abrupt reduction in active TB cases when all remaining individuals with active TB are brought in for treatment. You can also see the increase in TB tests and how twice as many smear-negative cases remain compared to smear-positive cases.
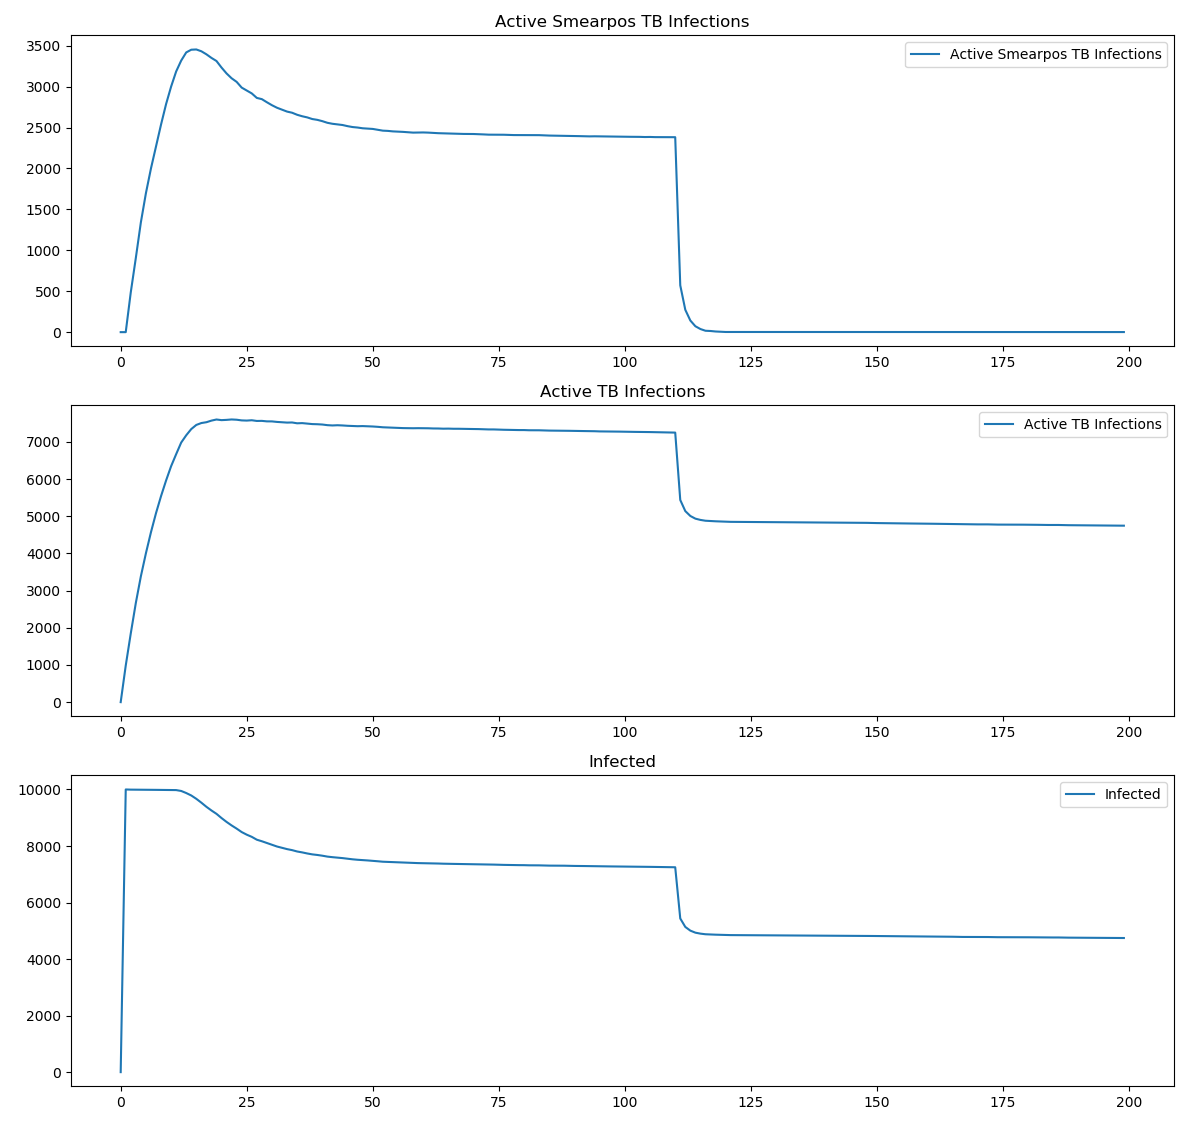
Figure 5: Infections with the active case finding strategy
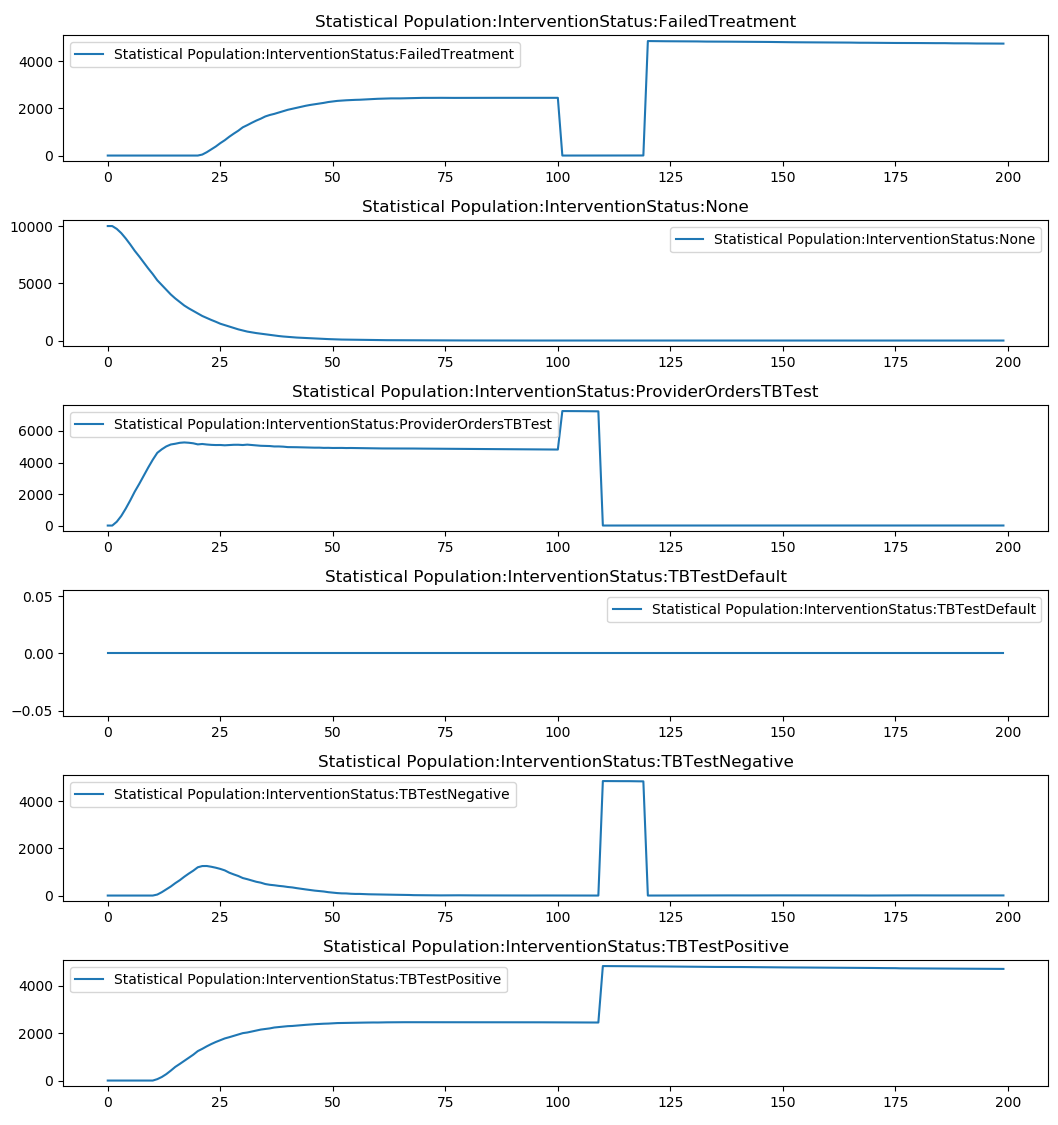
Figure 6: Population of each group in the care cascade