Populations with endemic TB
Areas where TB is endemic but present at low absolute prevalence are common. To model such a population, you cannot use the same modeling techniques described in other scenarios in which you configure a disease outbreak in a naive population and analyze the immediate aftermath. Instead, you must employ the following features:
A larger population size that allows a small number of infected individuals to be represented. The population age distribution remains constant throughout the scenario by the application of a fixed birth rate and an age-dependent mortality rate. See Population dynamics configuration parameters and Complex distributions demographic parameters for more information.
Population sampling so that an individual may represent more than one person in the population. This enables the simulation to run more quickly. For a disease like TB in which the disease progression may take decades, this is an important consideration. See Sampling parameters for more information.
Running the simulation for a longer period of time until the disease dynamics reach a steady state. The simulation output prior to that point is disregarded. This is a modeling concept known as simulation burn-in, borrowed from the electronics industry where the first items produced by a manufacturing process are discarded before the process is applied.
Using serialization to save the population state after it reaches equilibrium. Then, when you want to begin a subsequent simulation investigating the outcome of a particular set of interventions, you can begin the simulation at that point rather than needing to run the burn-in period again. See Simulation setup parameters for more information.
The following graphs show an example population burn-in scenario. To run these simulations yourself, see the TB/Population_BurnIn scenario in the downloadable EMODScenarios folder. Review the README files there for more information.
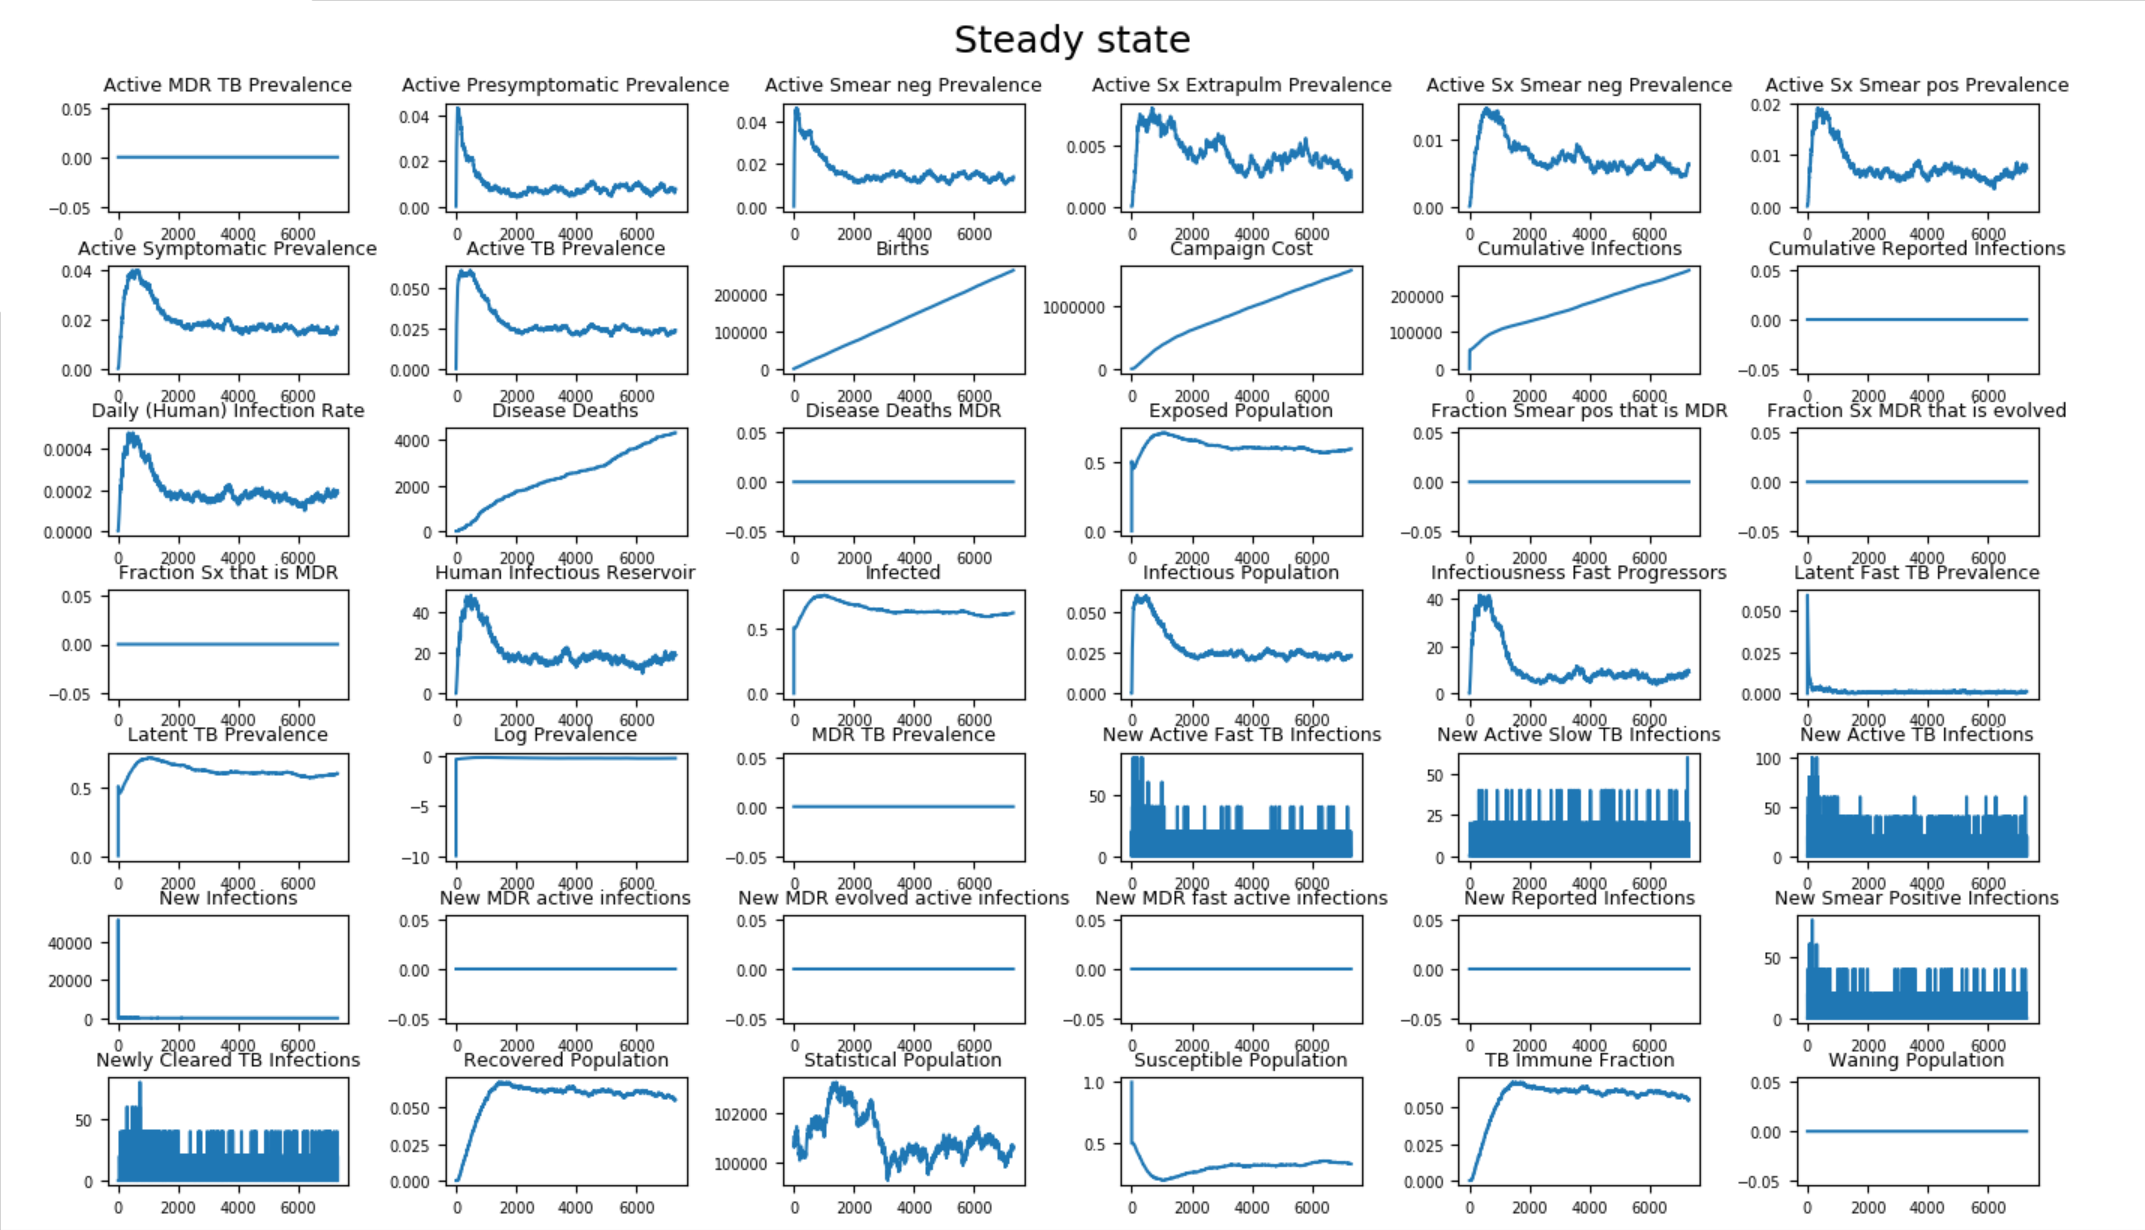
The figure below shows a burn-in simulation running for 100 years, which is initialized with half of the population being infected with TB. You can see this results in an initial peak of active disease that eventually reaches an equilibrium, aside from stochastic noise.

Figure 1: Burn-in period to reach steady state
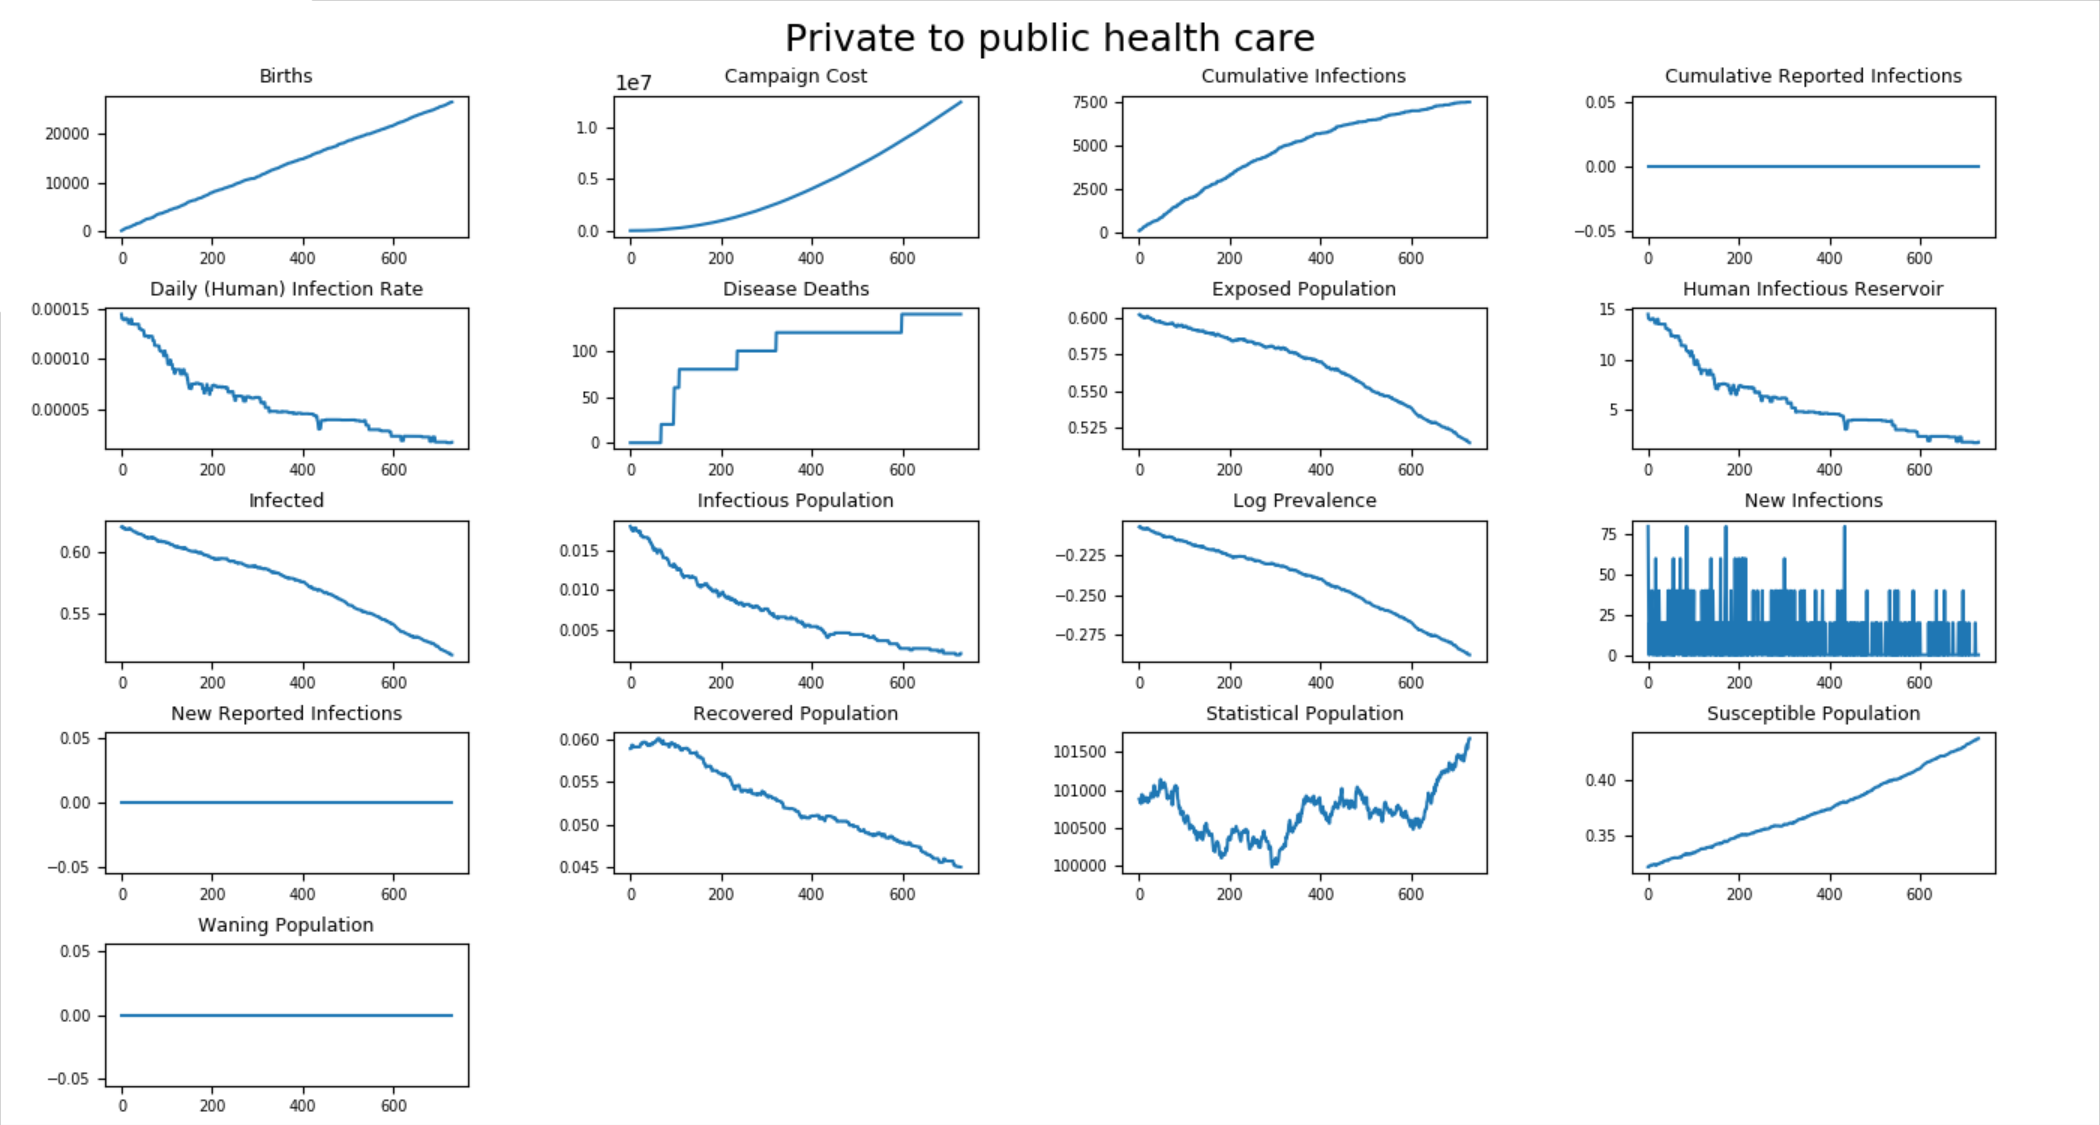
The configuration file used for the above scenario is set to save serialized population files at years 10, 20, 40, and 80. When you are ready to begin experimenting with different interventions, you can ingest the serialized file to begin the simulation at the desired time point without needing to re-run the burn-in period. The figure below shows the effect of improving care quality over the course of a 10-year period.

Figure 2: Health care improvements in an endemic setting