Treatment in multiple health care systems
In many regions, there are multiple health care systems that individuals may access. In many cases, the quality of care differs between them. For example, in China and India, public health systems have been found to offer more effective treatment with higher cure rates than private health systems.
This section walks through example scenarios in which patients are categorized into three groups: those who receive no care, those who receive care in the private health care system, and those who receive care in the public health care system. For purposes of illustration, these differences are exaggerated in the scenarios: all in public care get cured, while all in private care return to latent disease but relapse to active disease. Each of the subsequent scenarios builds upon the initial categorization by adding interventions to improve individuals’ access to care or the quality of care within a health system.
To run these simulations yourself, see the TB/Health_Systems scenario in the downloadable EMODScenarios folder. Review the README files there for more information.
Set up treatment regimens
Individuals are equally divided into three health care systems. All individuals are infected at the beginning of the simulation and progress quickly to active disease. One hundred days after TB activation, individuals who have private and public health care receive treatment, with the quality of care dependent on the health care system. The length of treatment is 50 days in either case. Treatment in the public sector is 100% curative while treatment in the private sector causes 100% of the patients to go into a latent state, after which they will relapse back into active disease.
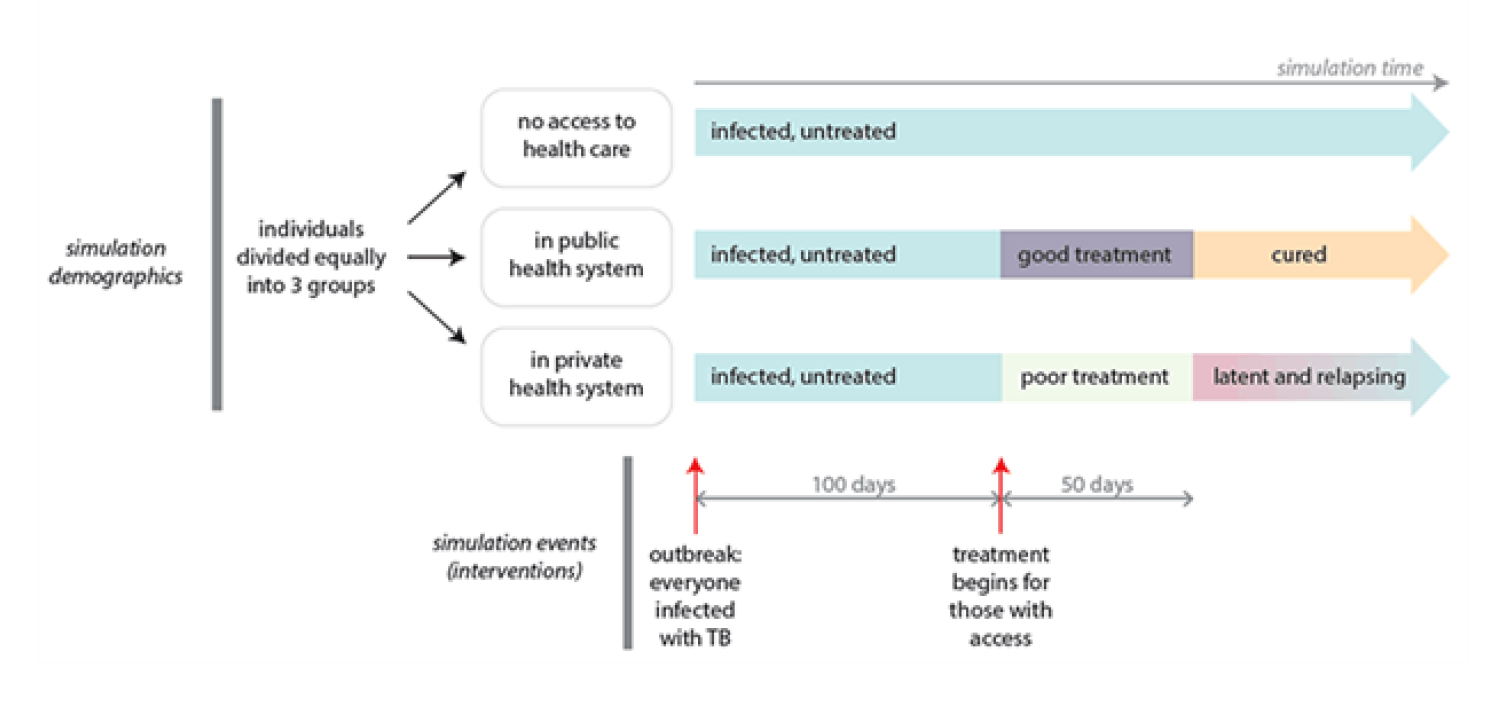
Figure 1: The quality of care in each system
To divide individuals into three health care groups, use individual properties in the demographics file. In this scenario, the property type QualityofCare is used to define the values None, Private, and Public. This creates the groups but does not define the quality of care received in each group. For more information, see Individual and node properties parameters.
To define the efficacy of the two different treatment regimens, the configuration parameter TBHIV_Drug_Params lists the different drugs with their respective cure rate, inactivation rate, relapse rate, and more. These rates are used to determine the weighted probability each of these events might occur during each time step. Only a single event can occur for the duration of a single treatment, and the probabilities are held fixed during the entire treatment. Thus, it is the combination of these rates and the total duration of treatment that determines the overall outcome rates of a treatment episode. If no event occurs during the treatment, then the individual is categorized as having failed treatment. TBHIV_Drug_Types lists the drugs that will be used for this simulation. For more information, see Drugs and treatments parameters.
Then, to actually distribute the treatment, you will create the campaign file. The campaign file uses a hierarchically nested structure to deliver interventions that are targeted to particular individuals, triggered by events (such as TB activation), or delayed to simulate how individuals seek out care. For more information on the file structure, see Campaign file.
In this scenario, three different interventions are nested within the same campaign event. First, NodeLevelHealthTriggeredIV triggers an intervention when an individual’s TB infection activates, then DelayedIntervention adds a 100 day delay before an individual seeks health care, and finally AntiTBDrug delivers different drugs based on the individual properties defined in the demographics file.
The following property report graph shows the course of the outbreak among each group with the above baseline values.
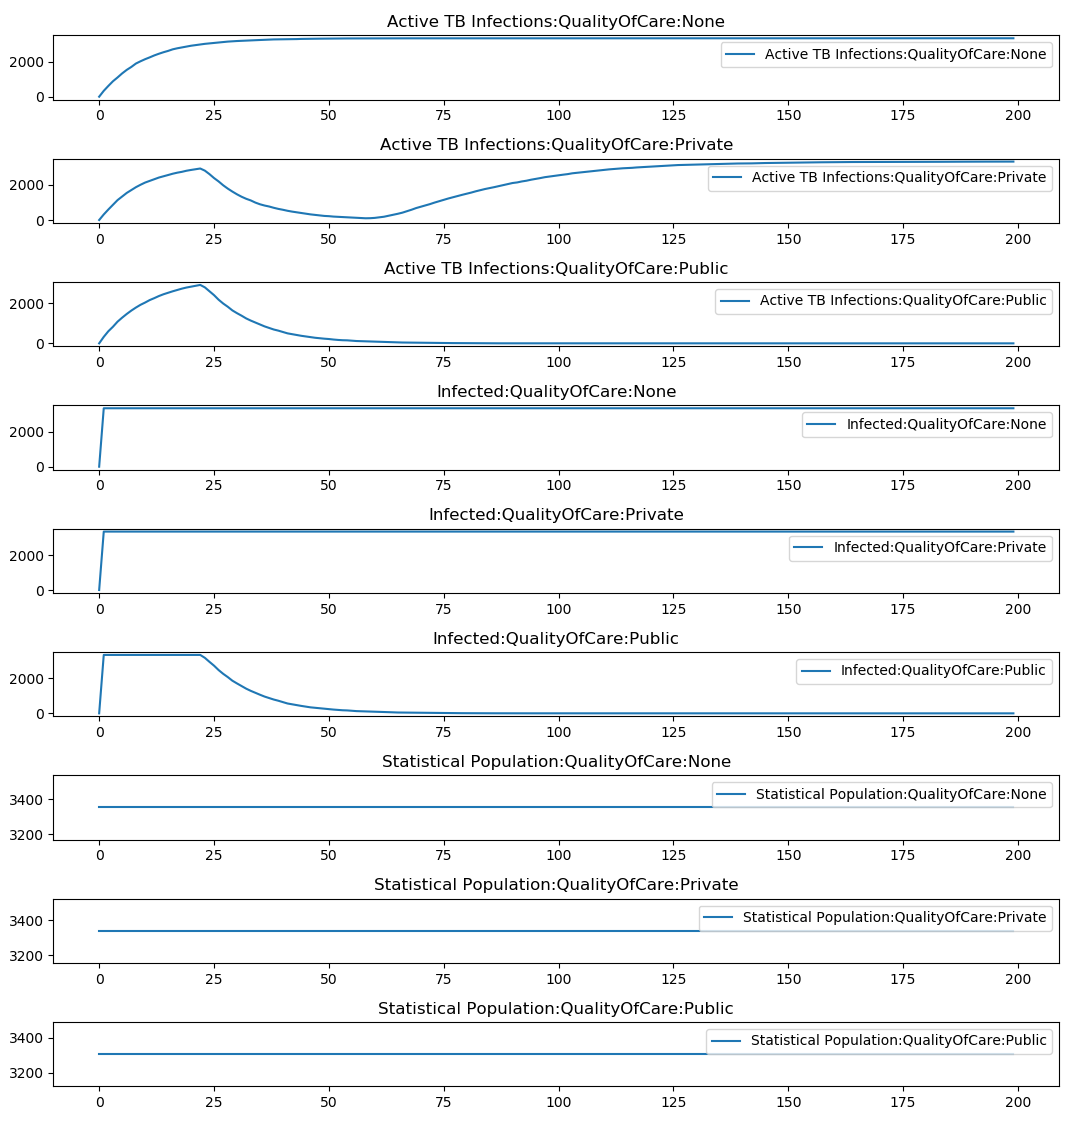
Figure 2: Baseline TB outbreak with private and public health systems
From no care to public care
This scenario examines the effect of shifting individuals who do not have access to health care into the public health care system on day 750. On day 850 they receive the standard public system curative treatment.
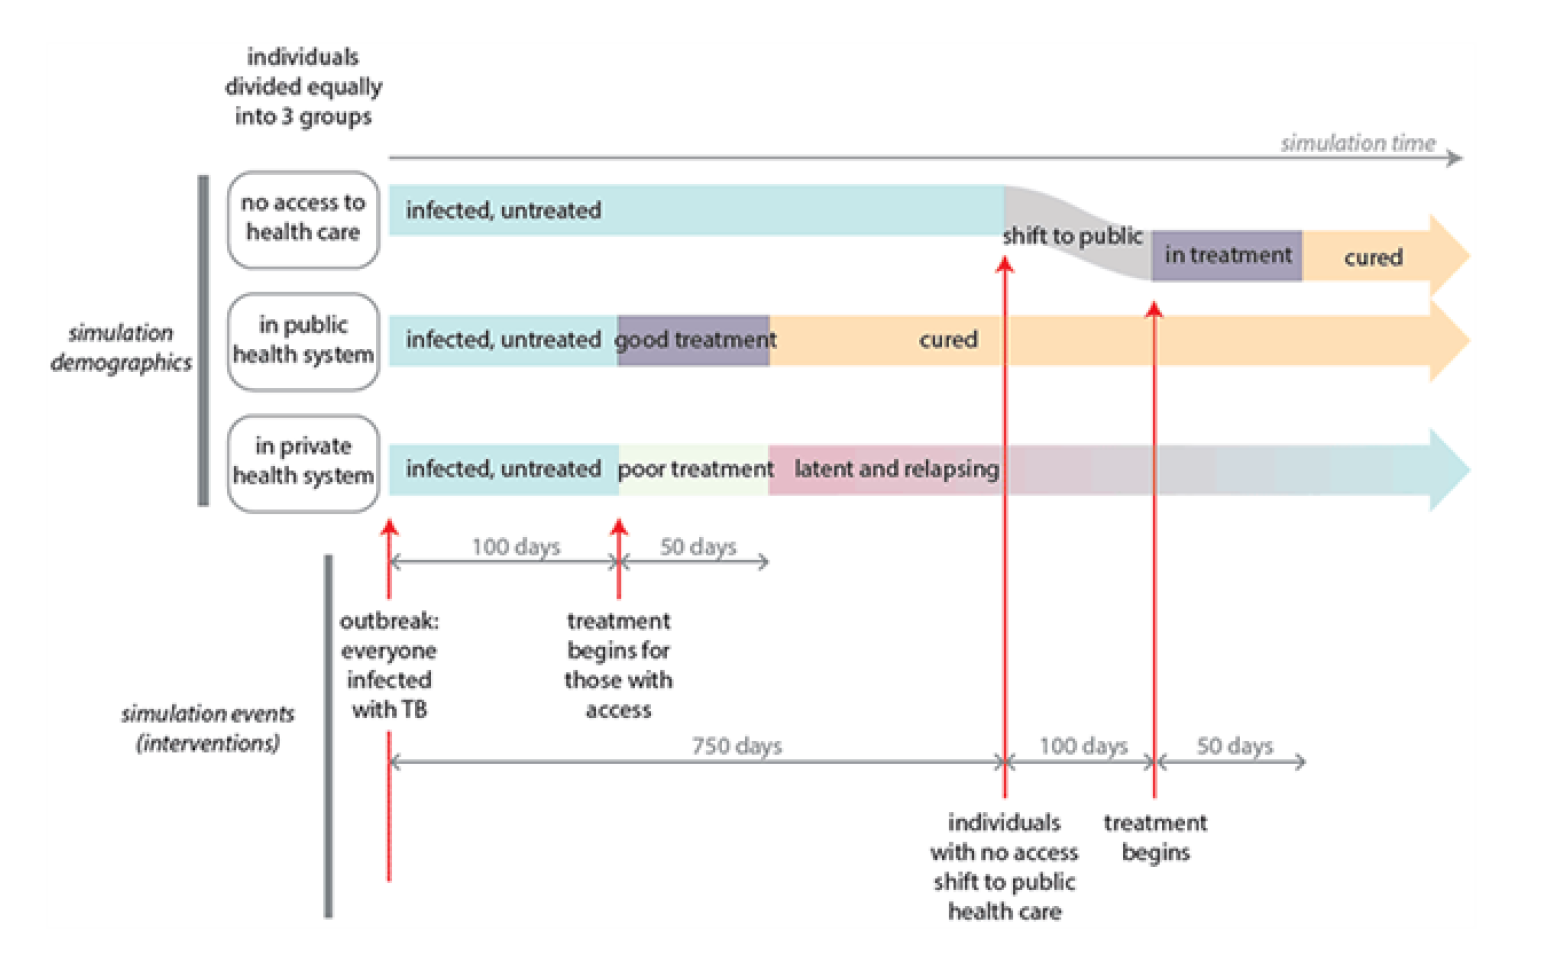
Figure 3: Transition those without access to care to the public system
In this scenario, the new intervention is distributed using PropertyValueChanger, which assigns the individual property value of Public to those who were originally assigned to None at day 750. Because the intervention is distributed on a particular day, it is not triggered by a particular event. Then the public drug regimen is distributed to those individuals again using AntiTBDrug.
This is clearly observed in the property report graph at day 750 where there is a drop in the active TB population in None and an increase in Public. This population is resident in Public for only 100 days, after which they receive curative treatment.
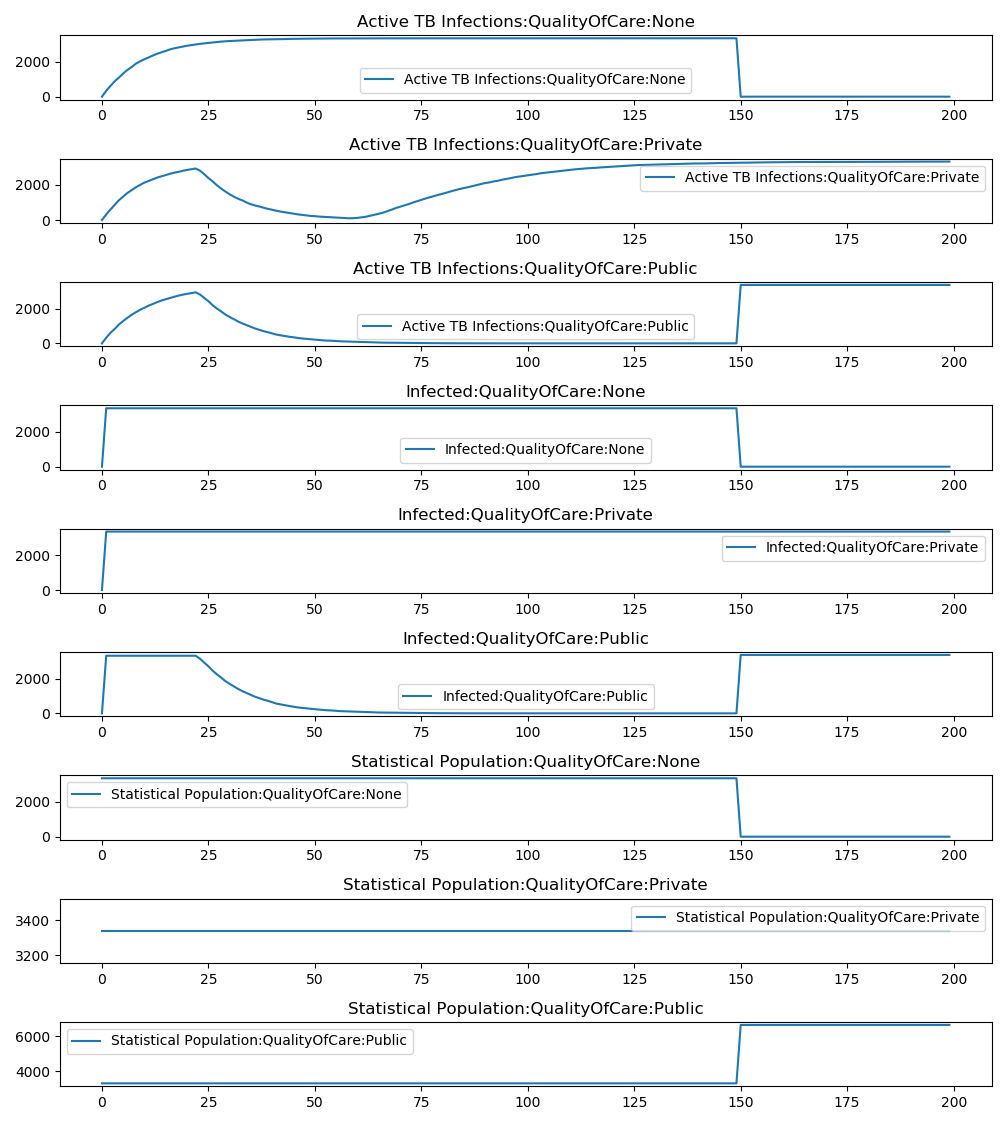
Figure 4: Transitioning individuals without care to the public system at day 750
From private care to public care
Individuals in the private health system receive treatment that causes latency and a subsequent relapse to active disease. In this scenario, at the time of relapse, individuals immediately shift from the private system to the public health system. After 100 days, they receive curative treatment in the public health care system.
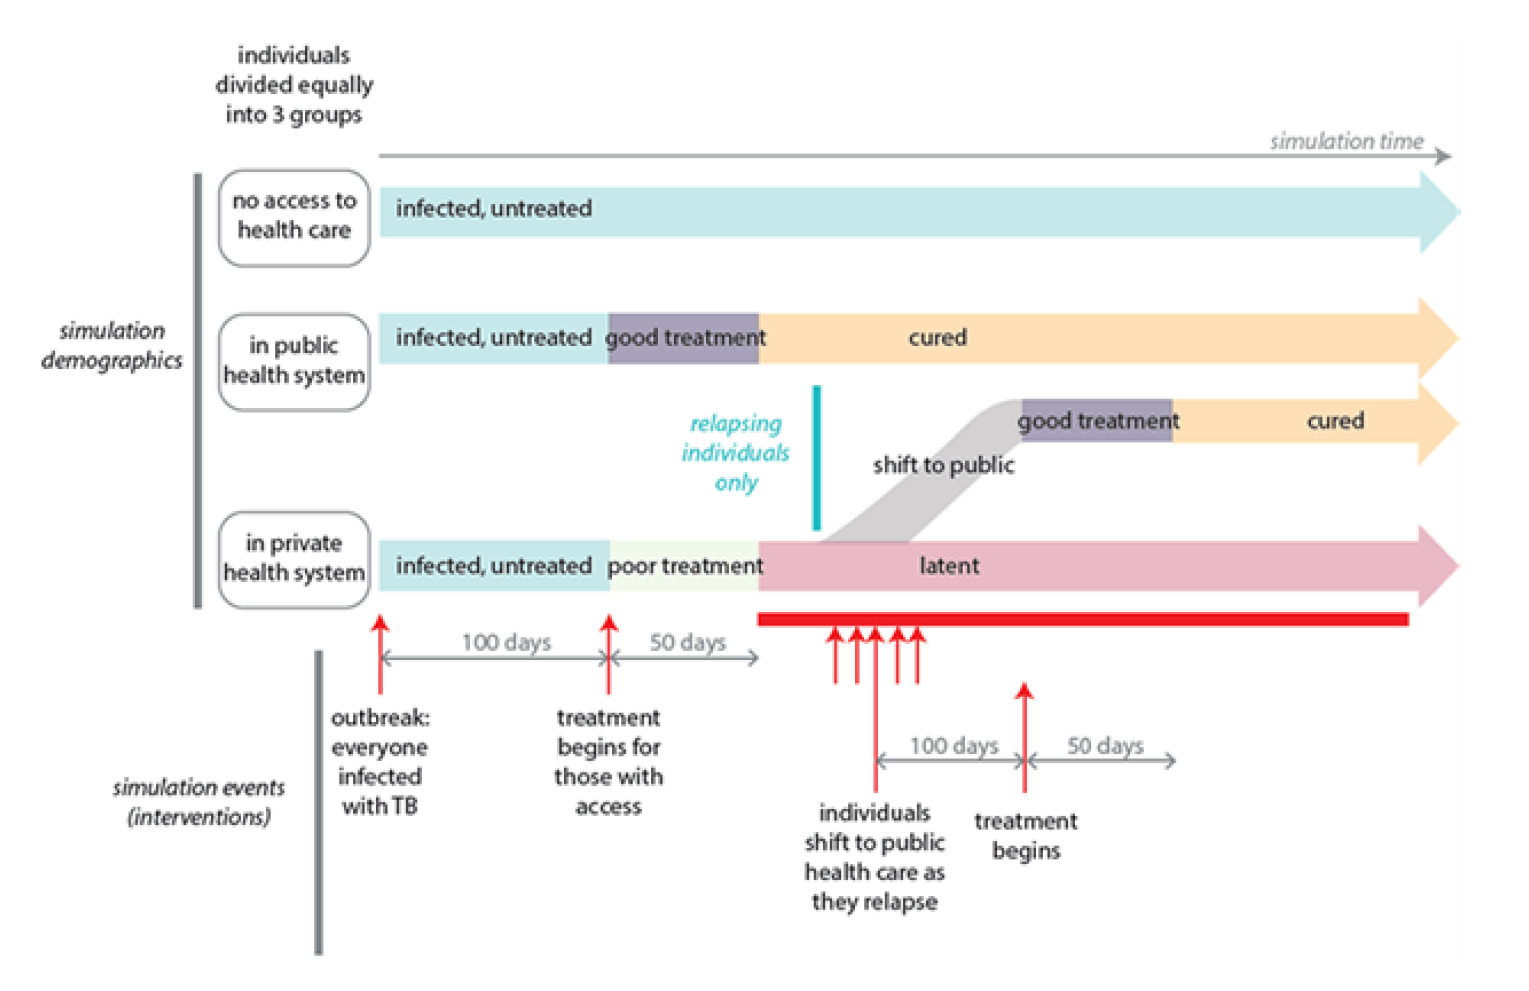
Figure 5: Treating relapsed TB using the public system
This scenario uses slightly different interventions in the campaign file. As with setting up the baseline health care system, you will use NodeLevelHealthTriggeredIV to trigger the intervention when an event occurs–in this case, it is the TBActivationPostRelapse event. This uses the Property_Restrictions_Within_Node parameter to restrict this only to individuals in the private health care system. As with the transition from no care to public care, this also uses the PropertyValueChanger intervention.
The property report graph below shows the more gradual increase in cases of active TB in the public care population as their latent TB reactivates and they are moved into the new care category, followed by a quick drop as their TB is cured.
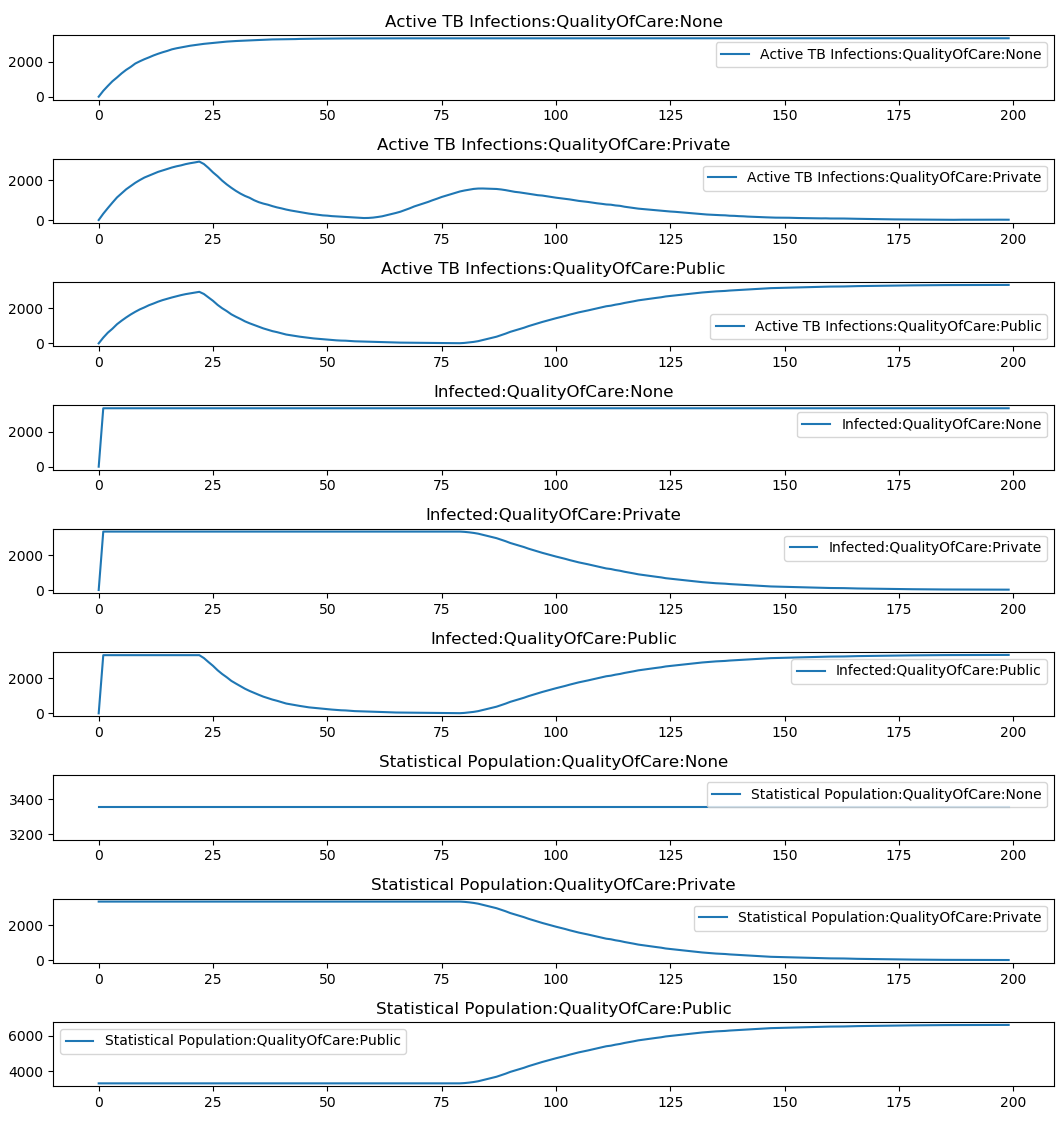
Figure 6: Treating relapsed TB using the public system
If you want to change a property value when an intervention is distributed, rather than changing it to allow an intervention to occur, you can use the New_Property_Value parameter. This is heavily used to simulate the ways individuals navigate through a complex health care cascade. See Cascade of care for general info and Case finding and cascade of care for a specific example relevant to TB care.
Private health care system improvement
Rather than transitioning individuals into different health care systems, this scenario improves the quality of care in the private health care system. At day 75, the private heath care intervention that is triggered by the TBActivation event is replaced with a drug intervention that is the same as the public health care intervention. Individuals who go into active TB after day 75 receive the improved TB treatment.
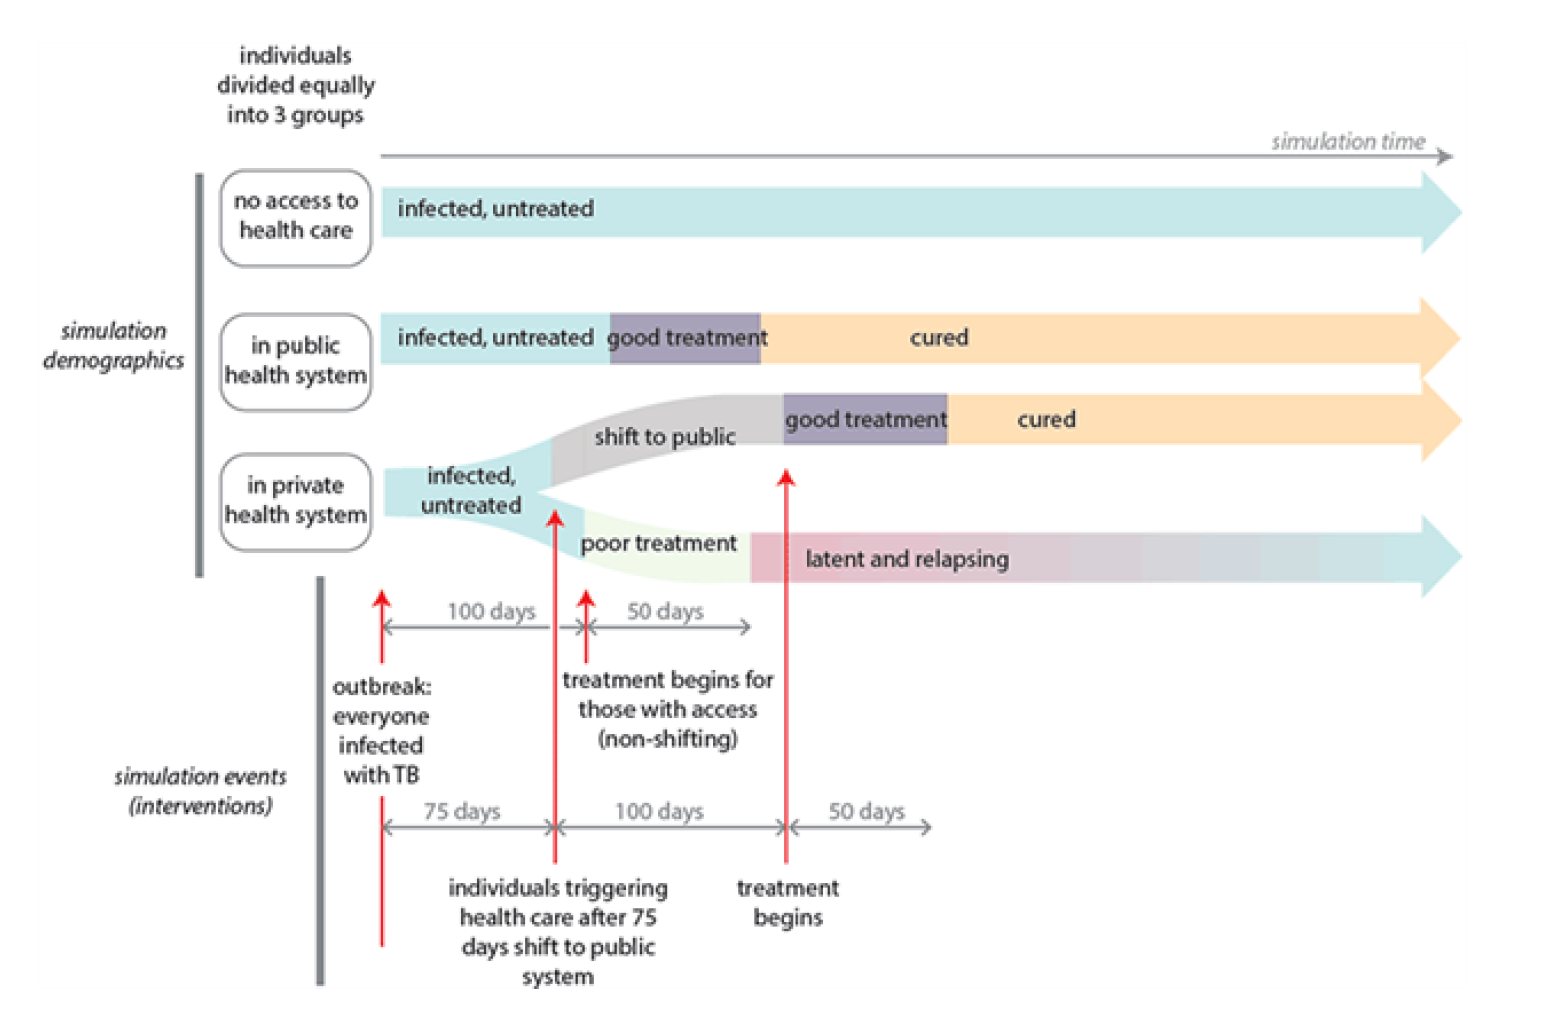
Figure 7: Making private health care equivalent to public after day 75
In the property report graph below, you can see how this improves the outcomes for individuals in the private health care system, but that they are still worse then the outcomes for the public system. Anyone whose TB infection activates prior to day 75 will receive inadequate care at day 100 that results in a latent infection that may relapse at a later date.
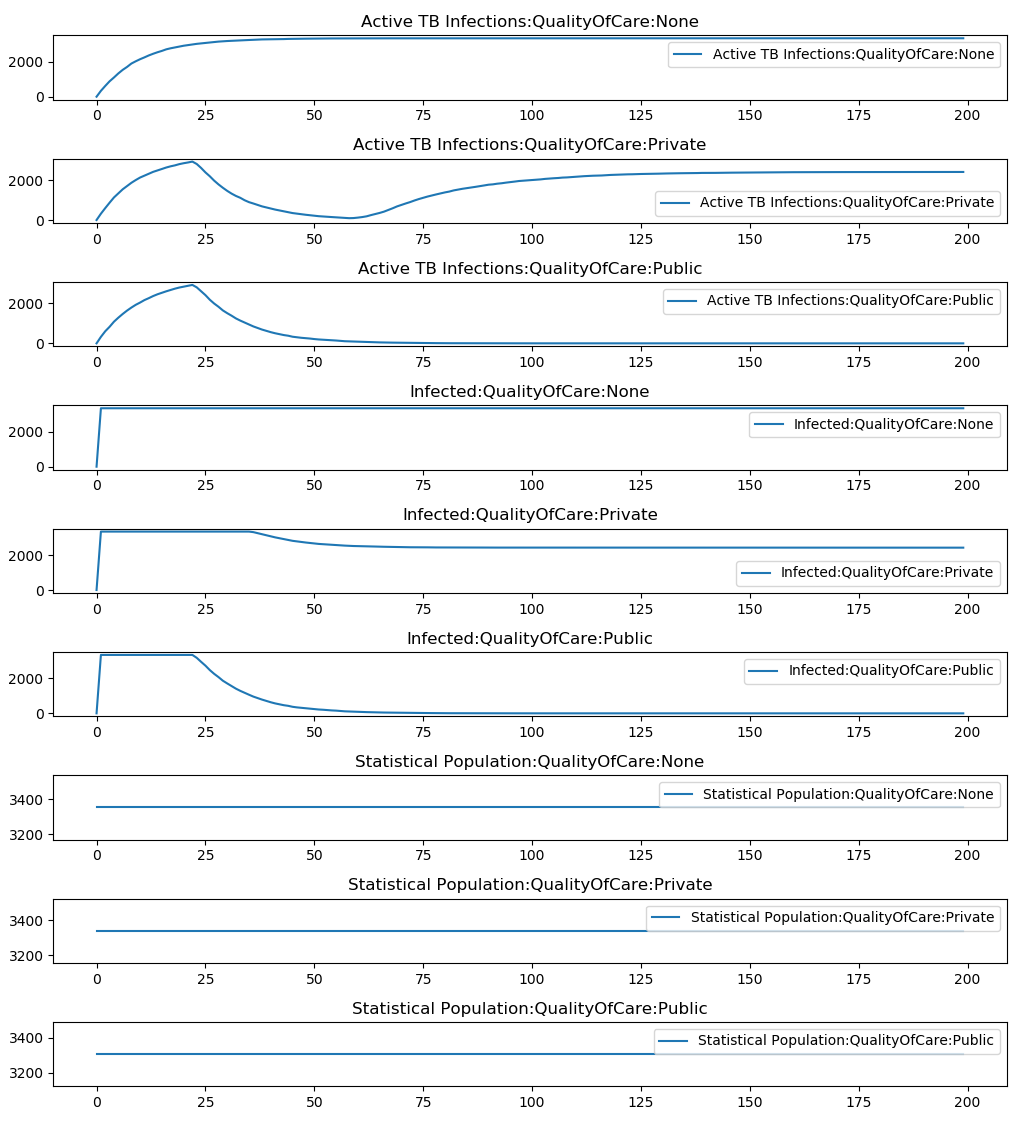
Figure 8: Making private health care equivalent to public after day 75