Disease progression
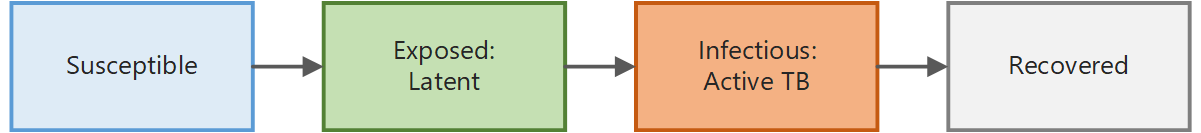
Epidemiological MODeling software (EMOD) represents the progression of TB disease using a series of state changes as individuals progress from susceptible to latent, to active infection, and then to recovery or death. The latent state represents asymptomatic individuals who are positive for the tuberculin skin test or interferon-gamma release assay (exposed) but not infectious. The active states represents infectious individuals who have signs or symptoms of TB. Therefore, you can represent the TB model as a type of SEIR model where latency corresponds to the exposed compartment and active TB corresponds to the infectious compartment as follows:
However, EMOD provides additional disease states to better capture the heterogeneity in disease progression and infectiousness. Within the broad categories of susceptible/latent/active, the model includes states for latent individuals where progression to active disease is slow or fast and states for active individuals who are presymptomatic or symptomatic with smear-positive pulmonary TB, smear-negative pulmonary TB, or extrapulmonary TB. The full TB model disease states are represented below:
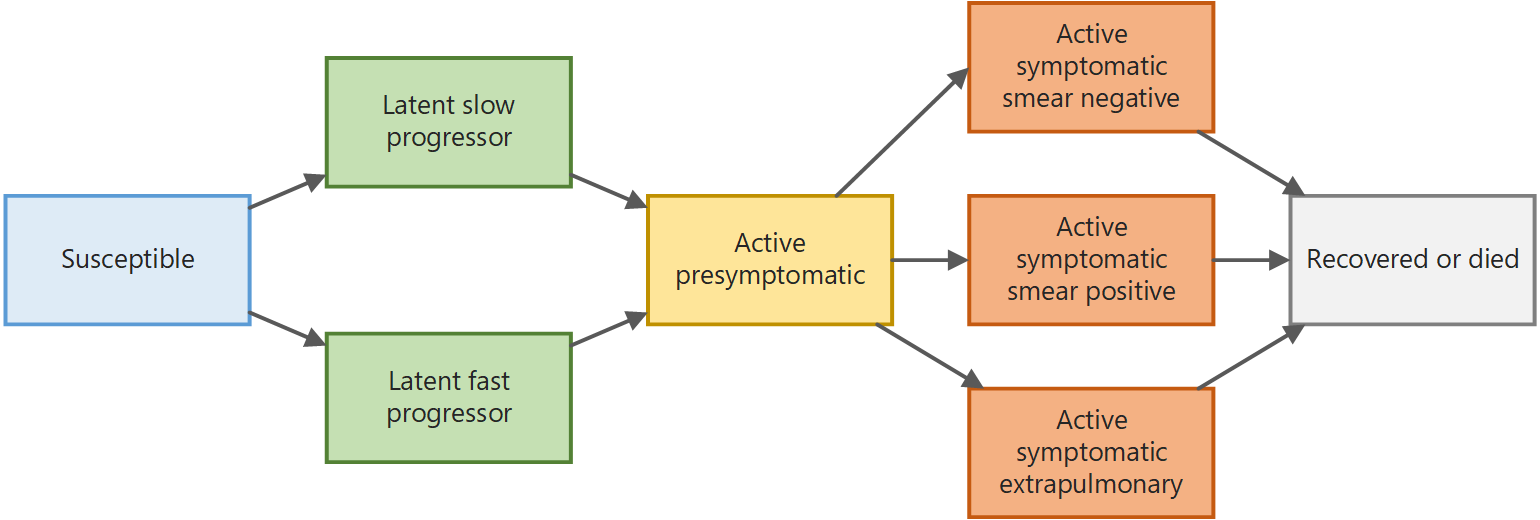
Individuals progress from a latently infected state to an active presymptomatic state before progressing to an active symptomatic state, reflecting the spectrum of disease from latent to active disease. The presymptomatic state represents a period of reduced infectivity where patients may have objective signs of TB (for example, an increased cough) but lack subjective symptoms (they do not notice their increased cough).
To view reference information for all TB parameter related to disease progression, see Disease progression parameters.
The following sections walk through some example simulations. To run these simulations yourself, see the TB/Disease_Progression scenario in the downloadable EMOD scenarios zip file. Review the README files there for more information.
SEIR baseline
By default, the TB model is configured with heterogeneity in disease progression and presentation. However, to better understand how to configure this heterogeneity, we recommend first simplifying the TB model to replicate an SEIR model by disabling TB-specific heterogeneity by configuring a single latent progression speed, a single symptomatic state, and a single disease presentation. You can use this example as a baseline, adding different kinds of heterogeneity to see how the output changes.
The following graphs show the inset chart and charts for all channels in a TB outbreak where the model has been simplified to replicate an SEIR model.
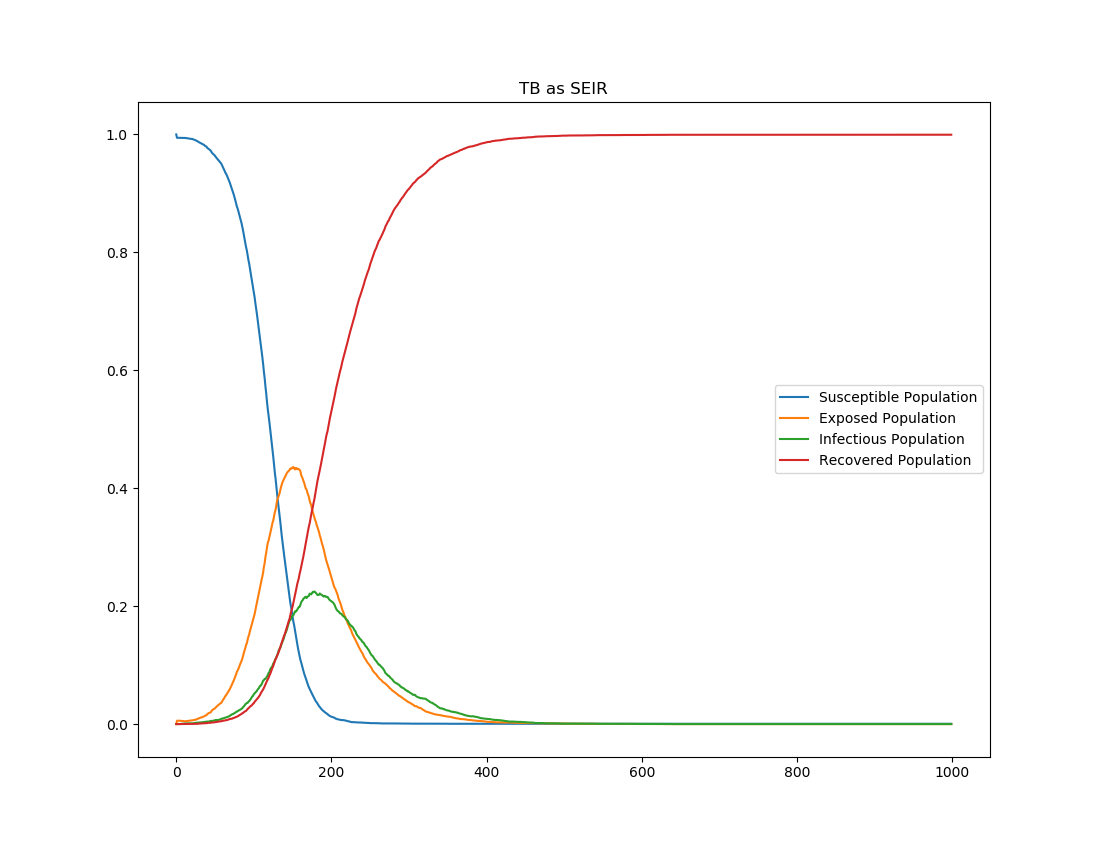
Figure 1: SEIR outputs from TB model simplified to replicate a SEIR model
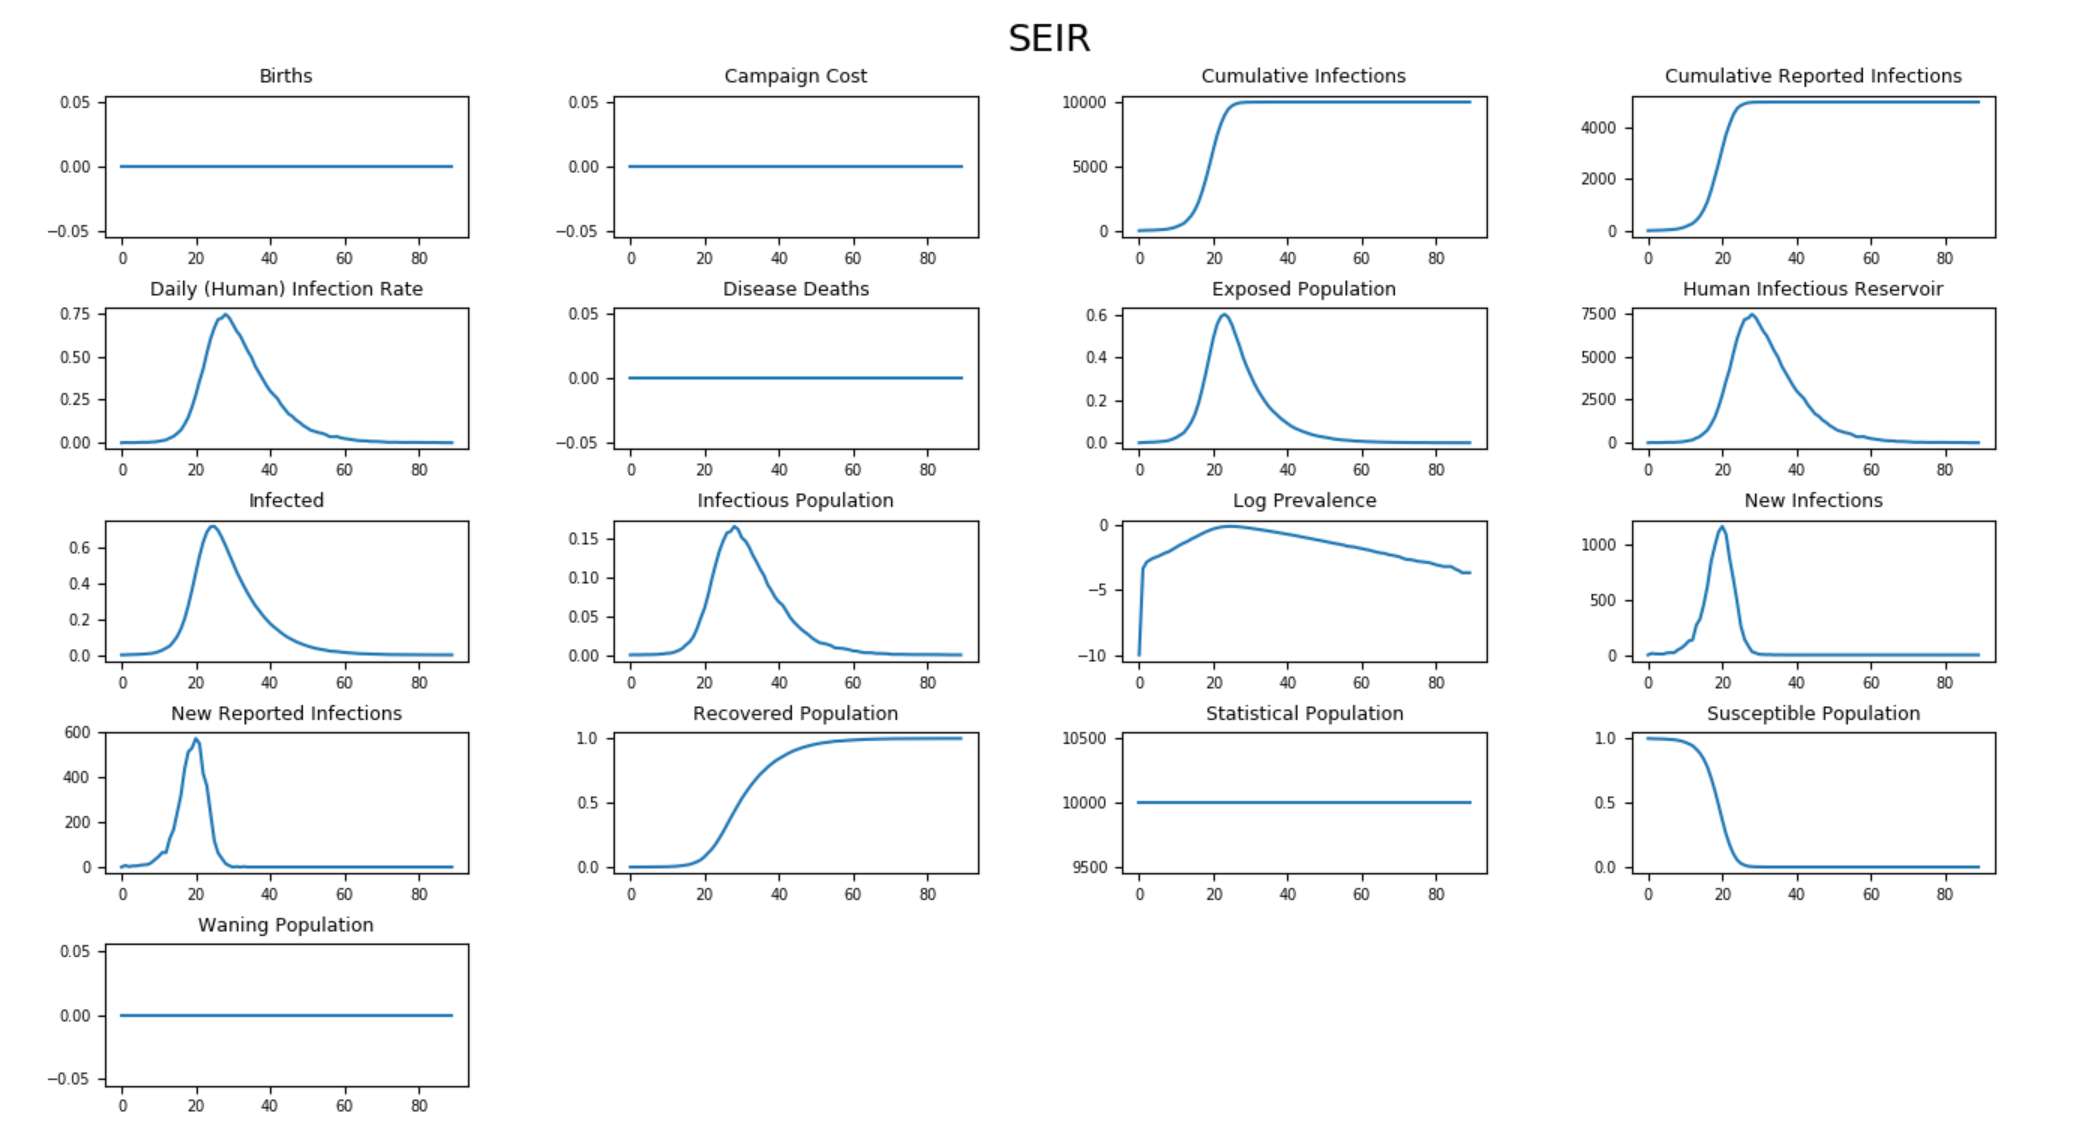
Figure 2: Additional outputs in a TB model simplified to replicate a SEIR model
Latency progression
TB can progress at very different rates for different people. For example, it tends to progress to disease more quickly in children than in adults. In the EMOD TB model, individuals are divided into two groups: fast and slow progressors. TB_Fast_Progressor_Fraction_Adult and TB_Fast_Progressor_Fraction_Child set the fraction of fast progressors among latently infected adults and children respectively, while the remaining latently infected individuals are considered slow progressors. The rate at which latent infections progress to active disease is set separately for fast and slow progressors via TB_Fast_Progressor_Rate and TB_Slow_Progressor_Rate, respectively.
The following graphs show the inset chart and charts for all channels for a TB outbreak where latently infected children and adults are evenly split between slow and fast progressors and fast progressors transition to the presymptomatic active state 10 times faster than slow progressors. In this example, all individuals move out of the presymptomatic state after only a day, effectively eliminating it.
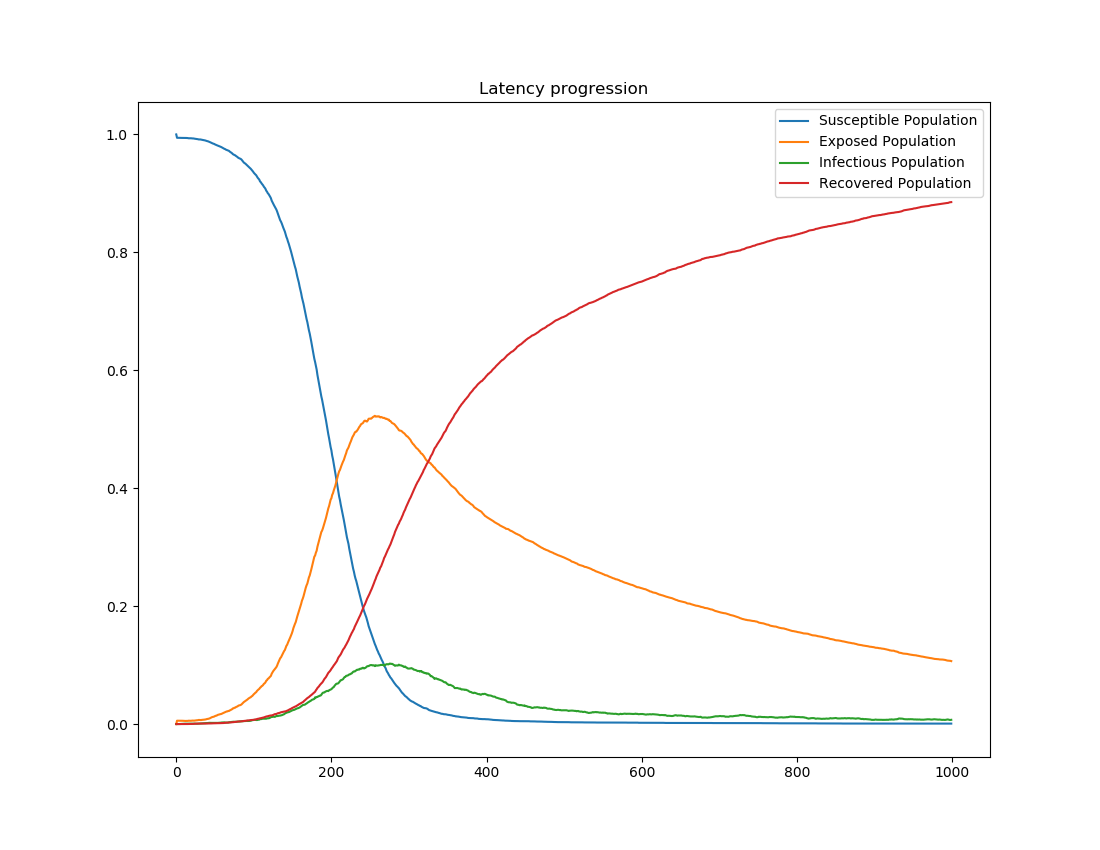
Figure 3: Course of outbreak with heterogeneity in the latency progression rate
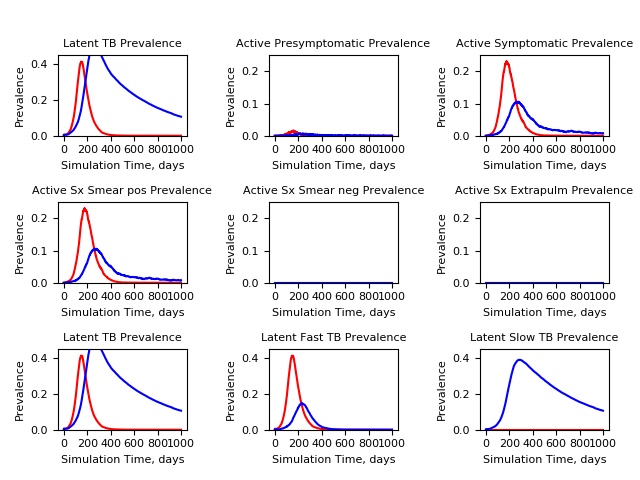
Figure 4: Comparison of SEIR baseline (red) with heterogeneous latency progression rate (blue)
Active disease presentation
Individuals with active TB are classified as smear-positive, smear-negative or extrapulmonary. These states are assumed to be mutually exclusive, so the fractions of individuals in these groups sum to unity. As with latency progression, children and adults are configured independently via parameters such as TB_Smear_Positive_Fraction_Adult and TB_Extrapulmonary_Fraction_Adult. Individuals with smear-negative disease are usually assumed to be less infectious than individuals with smear-positive disease as represented by TB_Smear_Negative_Infectivity_Multiplier. Individuals with extrapulmonary TB are assumed to be non-infectious and so have no configurable infectiousness.
The addition of a presymptomatic state can increase the time from initial infection to an active symptomatic disease state. When the rate of progression through the presymptomatic state is set slow enough as specified by TB_Presymptomatic_Rate this can slow the spread of disease within a cohort.
The following graphs show the inset chart and charts for all channels for an outbreak where presymptomatic individuals are not infectious and transition to active disease in approximately 30 days. Active symptomatic disease is evenly split among smear-positive, smear-negative, and extrapulmonary disease presentations. Extrapulmonary mortality is 40% of smear-positive, and infectiousness and mortality are the same for smear-negative and smear-positive TB. Heterogeneity in latency progression is not included.
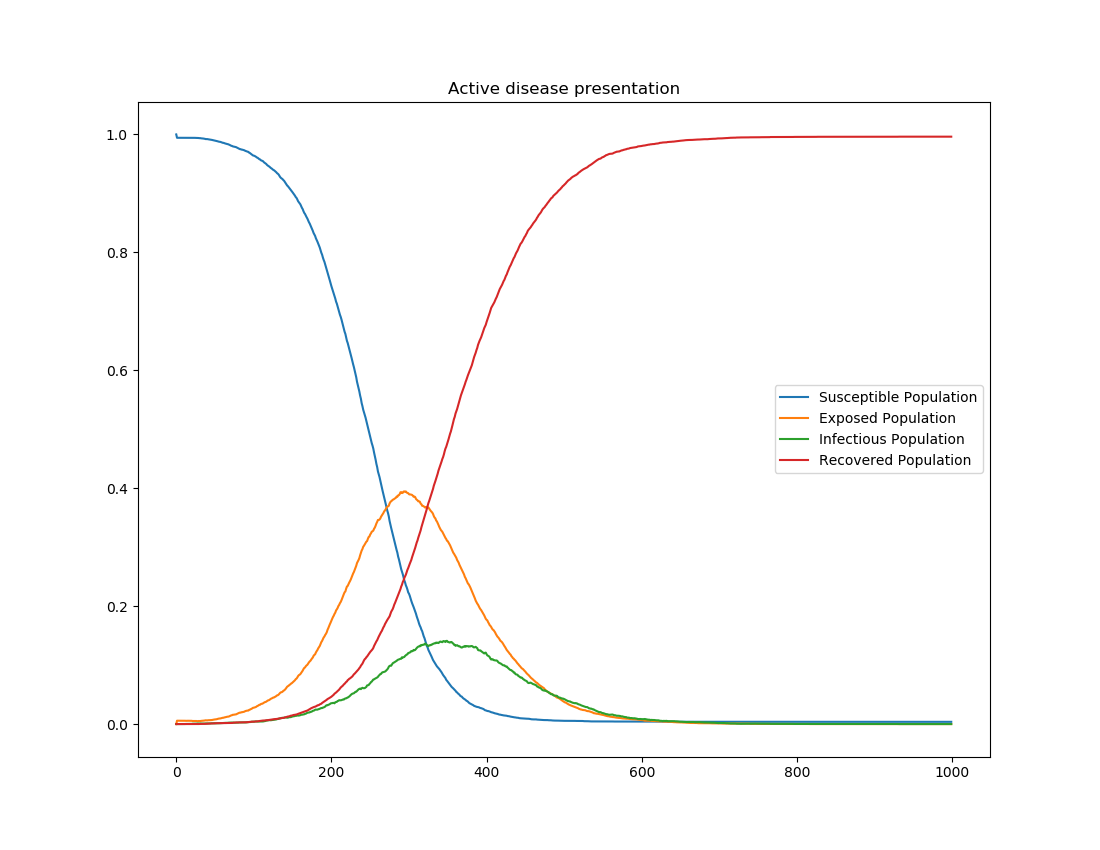
Figure 5: Course of outbreak with heterogeneity in active disease
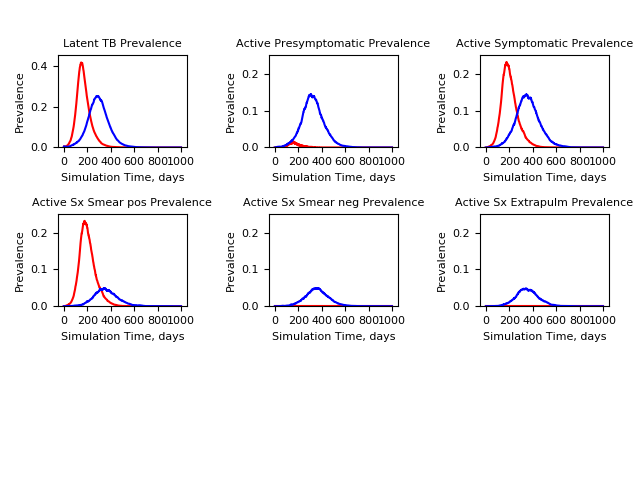
Figure 6: Comparison of SEIR baseline (red) with heterogeneous active disease (blue)