An interactive version of this notebook is available on Google Colab or Binder.
Understanding contraceptive use#
There are many factors that influence women’s decisions about contraceptive use. FPsim 2.0 brings enhancements that incorporate these factors. It also provides users with new flexibility for defining their own logic for how women make contraceptive decisions. We will illustrate some of this functionality in this tutorial.
First, some terminology. All of the logic for how women make contraception decisions is kept within a ContraceptiveChoice module. The default ContraceptiveChoice module within FPsim is StandardChoice. There is also a more detailed EmpoweredChoice module in an analysis repository.
Standard contraceptive choice#
This is the default option for how contraceptive decisions are made in FPsim. Under this option, a woman’s decision about whether to use contraception depends on her age, whether or not she has ever used contraception before, her level of education, her wealth quintile, her parity, and her geographical setting (urban/rural). Data on these variables is available from the Demographic and Health Survey (DHS).
The snippet below illustrates how to set up and run a simulation using the StandardChoice module.
[1]:
# Import FPsim and define the baseline parameters
import fpsim as fp
location = 'kenya'
pars = dict(location=location, n_agents=500, start_year=1980, end_year=2020, seed=1)

# Define the contraceptive choice module and the education module.
choice = fp.StandardChoice(location=location)
edu = fp.Education(location=location)

# Make and run sim
s = fp.Sim(pars, contraception_module=choice, education_module=edu)
s.run()
/home/docs/checkouts/readthedocs.org/user_builds/institute-for-disease-modeling-fpsim/envs/latest/lib/python3.11/site-packages/tqdm/auto.py:21: TqdmWarning: IProgress not found. Please update jupyter and ipywidgets. See https://ipywidgets.readthedocs.io/en/stable/user_install.html
  from .autonotebook import tqdm as notebook_tqdm
Loading data from files in /home/docs/checkouts/readthedocs.org/user_builds/institute-for-disease-modeling-fpsim/envs/latest/lib/python3.11/site-packages/fpsim/locations/kenya/data...
Applying calibration parameters for kenya...
Initializing sim with 500 agents
  Running 1980.01.01 ( 0/481) (0.00 s)  ———————————————————— 0%
  Running 1981.01.01 (12/481) (0.11 s)  ———————————————————— 3%
  Running 1982.01.01 (24/481) (0.24 s)  •——————————————————— 5%
  Running 1983.01.01 (36/481) (0.39 s)  •——————————————————— 8%
  Running 1984.01.01 (48/481) (0.53 s)  ••—————————————————— 10%
  Running 1985.01.01 (60/481) (0.67 s)  ••—————————————————— 13%
  Running 1986.01.01 (72/481) (0.81 s)  •••————————————————— 15%
  Running 1987.01.01 (84/481) (0.94 s)  •••————————————————— 18%
  Running 1988.01.01 (96/481) (1.09 s)  ••••———————————————— 20%
  Running 1989.01.01 (108/481) (1.24 s)  ••••———————————————— 23%
  Running 1990.01.01 (120/481) (1.37 s)  •••••——————————————— 25%
  Running 1991.01.01 (132/481) (1.51 s)  •••••——————————————— 28%
  Running 1992.01.01 (144/481) (1.65 s)  ••••••—————————————— 30%
  Running 1993.01.01 (156/481) (1.79 s)  ••••••—————————————— 33%
  Running 1994.01.01 (168/481) (1.94 s)  •••••••————————————— 35%
  Running 1995.01.01 (180/481) (2.08 s)  •••••••————————————— 38%
  Running 1996.01.01 (192/481) (2.22 s)  ••••••••———————————— 40%
  Running 1997.01.01 (204/481) (2.38 s)  ••••••••———————————— 43%
  Running 1998.01.01 (216/481) (2.53 s)  •••••••••——————————— 45%
  Running 1999.01.01 (228/481) (2.68 s)  •••••••••——————————— 48%
  Running 2000.01.01 (240/481) (2.83 s)  ••••••••••—————————— 50%
  Running 2001.01.01 (252/481) (2.98 s)  ••••••••••—————————— 53%
  Running 2002.01.01 (264/481) (3.13 s)  •••••••••••————————— 55%
  Running 2003.01.01 (276/481) (3.28 s)  •••••••••••————————— 58%
  Running 2004.01.01 (288/481) (3.44 s)  ••••••••••••———————— 60%
  Running 2005.01.01 (300/481) (3.59 s)  ••••••••••••———————— 63%
  Running 2006.01.01 (312/481) (3.73 s)  •••••••••••••——————— 65%
  Running 2007.01.01 (324/481) (3.88 s)  •••••••••••••——————— 68%
  Running 2008.01.01 (336/481) (4.03 s)  ••••••••••••••—————— 70%
  Running 2009.01.01 (348/481) (4.18 s)  ••••••••••••••—————— 73%
  Running 2010.01.01 (360/481) (4.33 s)  •••••••••••••••————— 75%
  Running 2011.01.01 (372/481) (4.49 s)  •••••••••••••••————— 78%
  Running 2012.01.01 (384/481) (4.62 s)  ••••••••••••••••———— 80%
  Running 2013.01.01 (396/481) (4.75 s)  ••••••••••••••••———— 83%
  Running 2014.01.01 (408/481) (4.89 s)  •••••••••••••••••——— 85%
  Running 2015.01.01 (420/481) (5.02 s)  •••••••••••••••••——— 88%
  Running 2016.01.01 (432/481) (5.16 s)  ••••••••••••••••••—— 90%
  Running 2017.01.01 (444/481) (5.29 s)  ••••••••••••••••••—— 93%
  Running 2018.01.01 (456/481) (5.43 s)  •••••••••••••••••••— 95%
  Running 2019.01.01 (468/481) (5.56 s)  •••••••••••••••••••— 98%
  Running 2020.01.01 (480/481) (5.71 s)  •••••••••••••••••••• 100%
[1]:
Sim(n=500; 1980—2020; demographics=deaths; connectors=contraception, edu, fp)
The SimpleChoice and RandomChoice modules#
Whilst the StandardChoice module will be appropriate for most analyses, we have also included two simpler versions, SimpleChoice and RandomChoice.
In the SimpleChoice module, a woman’s decision about whether to use contraception only depends on her age and whether or not she has ever used contraception before. Compared to the StandardChoice module, the SimpleChoice module disregards the influence of women’s education, wealth, parity, and urban/rural status on her contraceptive decisions.
The RandomChoice module is included only for testing purposes. In this module, women choose contraception at random. This module can be useful for sanity checking that the more realistic modules behave as expected.
It is recommended that use of the SimpleChoice and RandomChoice modules is reserved for testing purposes, as the StandardChoice captures more of the factors relevant for contraceptive decision making. Nevertheless, the example below shows how to use the SimpleChoice module. This example can also be considered as a template for anyone wishing to define their own contraceptive choice module.
[2]:
method_choice = fp.SimpleChoice(location=location)
sim = fp.Sim(pars=pars, contraception_module=method_choice, analyzers=fp.lifeof_recorder())
sim.run()
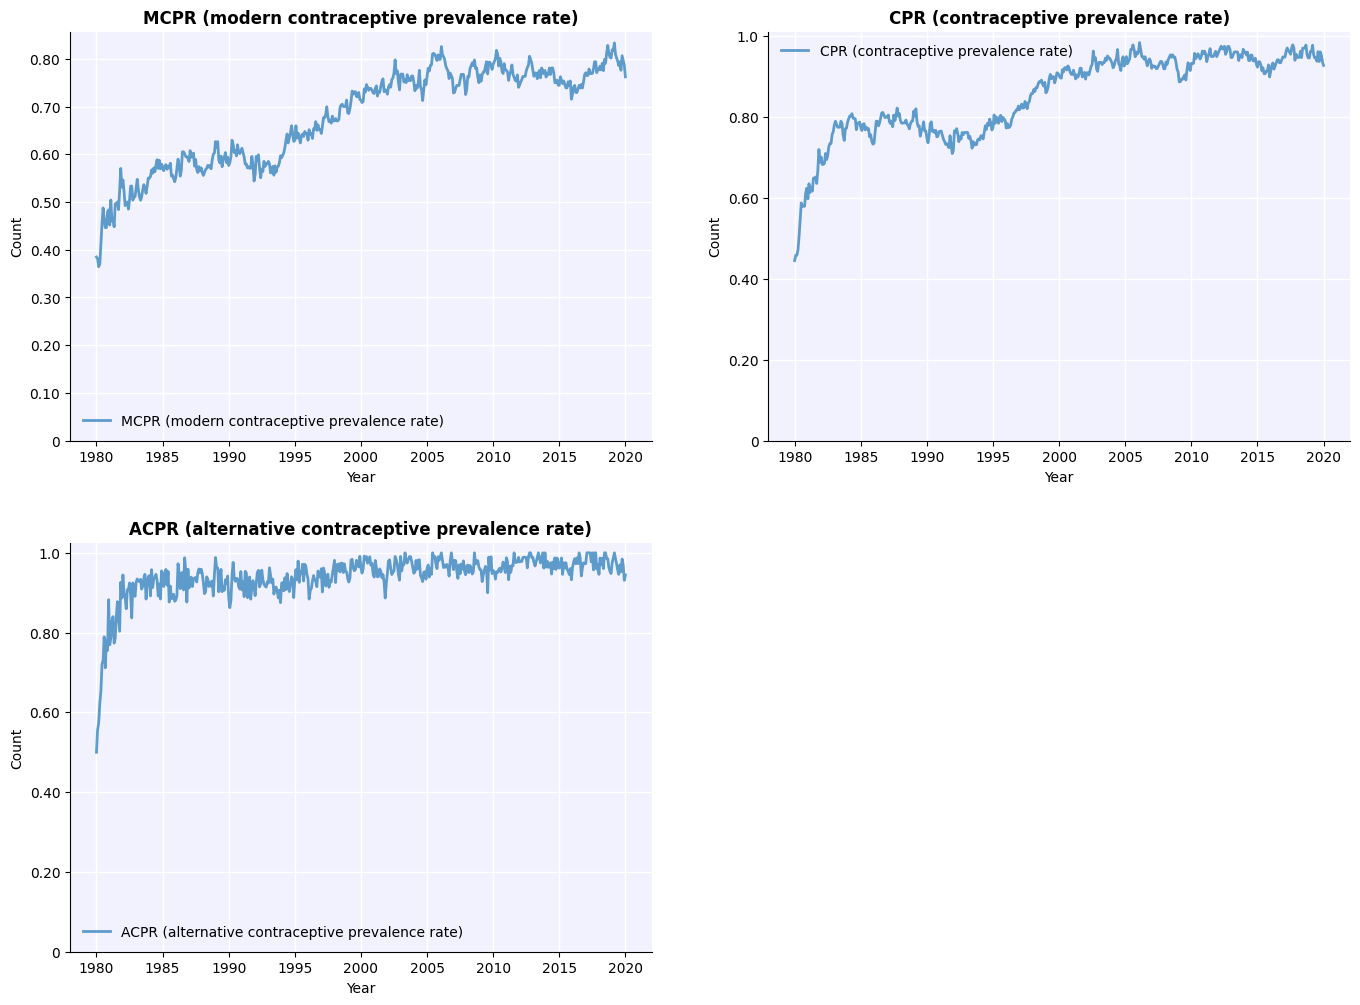
_ = sim.plot(to_plot='cpr');
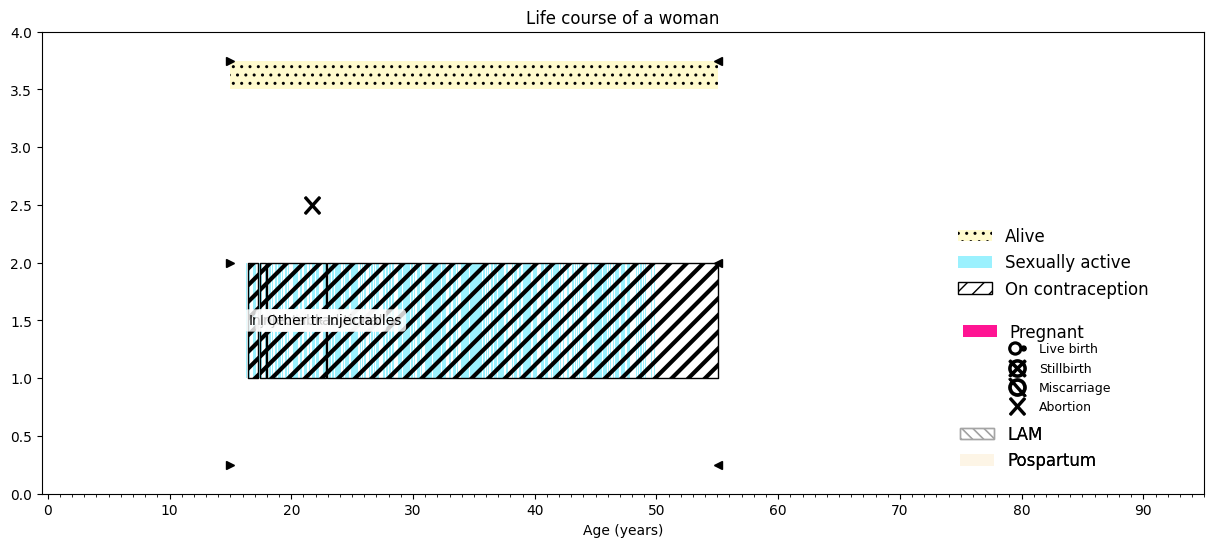
_ = sim.analyzers[0].plot(index=1); # plot the life events of one woman
Loading data from files in /home/docs/checkouts/readthedocs.org/user_builds/institute-for-disease-modeling-fpsim/envs/latest/lib/python3.11/site-packages/fpsim/locations/kenya/data...
Applying calibration parameters for kenya...
Initializing sim with 500 agents
  Running 1980.01.01 ( 0/481) (0.00 s)  ———————————————————— 0%
  Running 1981.01.01 (12/481) (0.11 s)  ———————————————————— 3%
  Running 1982.01.01 (24/481) (0.23 s)  •——————————————————— 5%
  Running 1983.01.01 (36/481) (0.35 s)  •——————————————————— 8%
  Running 1984.01.01 (48/481) (0.48 s)  ••—————————————————— 10%
  Running 1985.01.01 (60/481) (0.59 s)  ••—————————————————— 13%
  Running 1986.01.01 (72/481) (0.72 s)  •••————————————————— 15%
  Running 1987.01.01 (84/481) (0.85 s)  •••————————————————— 18%
  Running 1988.01.01 (96/481) (0.99 s)  ••••———————————————— 20%
  Running 1989.01.01 (108/481) (1.11 s)  ••••———————————————— 23%
  Running 1990.01.01 (120/481) (1.23 s)  •••••——————————————— 25%
  Running 1991.01.01 (132/481) (1.36 s)  •••••——————————————— 28%
  Running 1992.01.01 (144/481) (1.50 s)  ••••••—————————————— 30%
  Running 1993.01.01 (156/481) (1.62 s)  ••••••—————————————— 33%
  Running 1994.01.01 (168/481) (1.76 s)  •••••••————————————— 35%
  Running 1995.01.01 (180/481) (1.88 s)  •••••••————————————— 38%
  Running 1996.01.01 (192/481) (2.01 s)  ••••••••———————————— 40%
  Running 1997.01.01 (204/481) (2.16 s)  ••••••••———————————— 43%
  Running 1998.01.01 (216/481) (2.30 s)  •••••••••——————————— 45%
  Running 1999.01.01 (228/481) (2.44 s)  •••••••••——————————— 48%
  Running 2000.01.01 (240/481) (2.59 s)  ••••••••••—————————— 50%
  Running 2001.01.01 (252/481) (2.74 s)  ••••••••••—————————— 53%
  Running 2002.01.01 (264/481) (2.87 s)  •••••••••••————————— 55%
  Running 2003.01.01 (276/481) (3.01 s)  •••••••••••————————— 58%
  Running 2004.01.01 (288/481) (3.15 s)  ••••••••••••———————— 60%
  Running 2005.01.01 (300/481) (3.29 s)  ••••••••••••———————— 63%
  Running 2006.01.01 (312/481) (3.43 s)  •••••••••••••——————— 65%
  Running 2007.01.01 (324/481) (3.56 s)  •••••••••••••——————— 68%
  Running 2008.01.01 (336/481) (3.70 s)  ••••••••••••••—————— 70%
  Running 2009.01.01 (348/481) (3.83 s)  ••••••••••••••—————— 73%
  Running 2010.01.01 (360/481) (3.96 s)  •••••••••••••••————— 75%
  Running 2011.01.01 (372/481) (4.09 s)  •••••••••••••••————— 78%
  Running 2012.01.01 (384/481) (4.21 s)  ••••••••••••••••———— 80%
  Running 2013.01.01 (396/481) (4.32 s)  ••••••••••••••••———— 83%
  Running 2014.01.01 (408/481) (4.45 s)  •••••••••••••••••——— 85%
  Running 2015.01.01 (420/481) (4.58 s)  •••••••••••••••••——— 88%
  Running 2016.01.01 (432/481) (4.70 s)  ••••••••••••••••••—— 90%
  Running 2017.01.01 (444/481) (4.83 s)  ••••••••••••••••••—— 93%
  Running 2018.01.01 (456/481) (4.95 s)  •••••••••••••••••••— 95%
  Running 2019.01.01 (468/481) (5.07 s)  •••••••••••••••••••— 98%
  Running 2020.01.01 (480/481) (5.19 s)  •••••••••••••••••••• 100%
NOTE: FPsim 2.0 was specifically designed to support the analyses in the related analysis repository, which address two evolutions in the current family planning research landscape: centering women’s intentions and preferences; and considering the broader impact of family planning on women’s empowerment. This repository also contains more details on how to define a custom contraceptive choice module.
In the next tutorial, you wil learn how to define and run an intervention.