An interactive version of this notebook is available on Google Colab or Binder.
Select a specific subpopulation for an intervention#
At this point, you should now be able to run multiple simulations with distinct interventions, using default or custom parameters and plot the results. So far we’ve seen interventions that target a model parameter. Now we will see how we can we specify a function that tells FPsim who will receive the intervention. First, import the model and set your default settings.
[1]:
import fpsim as fp      # Main FPsim module
import sciris as sc     # For utilities
import starsim as ss    # For running multiple sims in parallel
import matplotlib.pyplot as plt  # For plotting
/home/docs/checkouts/readthedocs.org/user_builds/institute-for-disease-modeling-fpsim/envs/latest/lib/python3.11/site-packages/tqdm/auto.py:21: TqdmWarning: IProgress not found. Please update jupyter and ipywidgets. See https://ipywidgets.readthedocs.io/en/stable/user_install.html
  from .autonotebook import tqdm as notebook_tqdm
[2]:
location = 'kenya'
pars = dict(
    n_agents   = 1_000,
    location   = location,
    start_year = 2000,
    end_year   = 2012,
    exposure_factor = 1.0  # Overall scale factor on probability of becoming pregnant
)
Now, we will modify a ‘state’ value of all eligible women. To see all the states you can select based on, run this code:
[3]:
from fpsim.defaults import fpmod_states
for i, state in enumerate(fpmod_states): print(f"{i}: {state.name}")
0: on_contra
1: method
2: ti_contra
3: barrier
4: ever_used_contra
5: intent_to_use
6: fertility_intent
7: fertility_intent_cat
8: rel_sus
9: lam
10: pregnant
11: fertile
12: sexually_active
13: sexual_debut
14: lactating
15: postpartum
16: sexual_debut_age
17: fated_debut
18: first_birth_age
19: parity
20: n_births
21: n_stillbirths
22: n_miscarriages
23: n_abortions
24: n_pregnancies
25: months_inactive
26: short_interval
27: gestation
28: remainder_months
29: dur_pregnancy
30: dur_postpartum
31: dur_breastfeed
32: dur_breastfeed_total
33: ti_conceived
34: ti_pregnant
35: ti_delivery
36: ti_last_delivery
37: ti_live_birth
38: ti_stillbirth
39: ti_postpartum
40: ti_miscarriage
41: ti_abortion
42: ti_stop_postpartum
43: ti_stop_breastfeeding
44: ti_debut
45: ti_dead
46: personal_fecundity
47: birth_ages
48: stillborn_ages
49: miscarriage_ages
50: abortion_ages
51: partnered
52: partnership_age
Increase the number of women who have education#
The change_people_state intervention can be used to change ‘states’ or attributes of women. The states you can change are the same list of target states from above. Let’s see what would hapen if we increase education. In FPsim, education is defined based on an education objective and education attainment. The education objective is given to each woman when she enters the model. During her school age years, she gains one year of educationl attainment each year until she reaches her objective.
This trajectory can be interrupted if she experiences a pregnancy during those years.
First, we will identify our eligible subpopulation for this intervention. In this case, we are selecting all women who have a goal to achieve at least one year of education.
[4]:
def select_undereducated(sim):
    """ Select women who have a goal to achieve at least 1 year of education """
    is_eligible = ((sim.people.female) &
                   (sim.people.alive)     &
                   (sim.people.edu.objective > 0))
    return is_eligible
Now, define a baseline simulation, s0, with no changes.
[5]:
edu = fp.Education(location=location)
s0 = fp.Sim(pars=pars, education_module=edu, label='Baseline')
Loading data from files in /home/docs/checkouts/readthedocs.org/user_builds/institute-for-disease-modeling-fpsim/envs/latest/lib/python3.11/site-packages/fpsim/locations/kenya/data...
Applying calibration parameters for kenya...
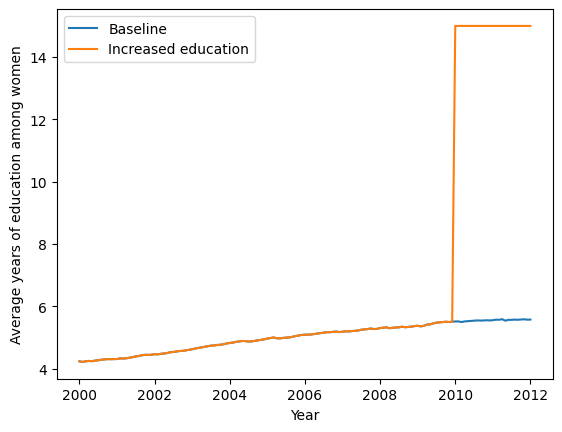
Next, we define our education change intervention. This intervention finds all of the eligible women (those with a goal of achieveing at least 1 year of education), and gives all of them 15 years of education, starting in the year 2010. We define a simulation, s1, with this educaiton intervention.
[6]:
change_education = fp.change_people_state(
                        'edu.attainment',
                        eligibility=select_undereducated,
                        years=2010.0,
                        new_val=15,  # Give all selected women 15 years of education
                    )
edu = fp.Education(location=location)
s1 = fp.Sim(pars=pars,
            education_module=edu,
            interventions=change_education,
            label='Increased education')
Loading data from files in /home/docs/checkouts/readthedocs.org/user_builds/institute-for-disease-modeling-fpsim/envs/latest/lib/python3.11/site-packages/fpsim/locations/kenya/data...
Applying calibration parameters for kenya...
Run a multile simulation run with msim to get the results of both of these simulations.
[7]:
msim = ss.MultiSim(sims=[s0, s1])
msim.run(parallel=False)
s0, s1 = msim.sims
Initializing sim "Baseline" with 1000 agents
  Running "Baseline": 2000.01.01 ( 0/145) (0.00 s)  ———————————————————— 1%
  Running "Baseline": 2001.01.01 (12/145) (0.13 s)  •——————————————————— 9%
  Running "Baseline": 2002.01.01 (24/145) (0.30 s)  •••————————————————— 17%
  Running "Baseline": 2003.01.01 (36/145) (0.46 s)  •••••——————————————— 26%
  Running "Baseline": 2004.01.01 (48/145) (0.63 s)  ••••••—————————————— 34%
  Running "Baseline": 2005.01.01 (60/145) (0.81 s)  ••••••••———————————— 42%
  Running "Baseline": 2006.01.01 (72/145) (0.97 s)  ••••••••••—————————— 50%
  Running "Baseline": 2007.01.01 (84/145) (1.12 s)  •••••••••••————————— 59%
  Running "Baseline": 2008.01.01 (96/145) (1.30 s)  •••••••••••••——————— 67%
  Running "Baseline": 2009.01.01 (108/145) (1.48 s)  •••••••••••••••————— 75%
  Running "Baseline": 2010.01.01 (120/145) (1.65 s)  ••••••••••••••••———— 83%
  Running "Baseline": 2011.01.01 (132/145) (1.83 s)  ••••••••••••••••••—— 92%
  Running "Baseline": 2012.01.01 (144/145) (2.02 s)  •••••••••••••••••••• 100%

Initializing sim "Increased education" with 1000 agents
  Running "Increased education": 2000.01.01 ( 0/145) (0.00 s)  ———————————————————— 1%
  Running "Increased education": 2001.01.01 (12/145) (0.13 s)  •——————————————————— 9%
  Running "Increased education": 2002.01.01 (24/145) (0.29 s)  •••————————————————— 17%
  Running "Increased education": 2003.01.01 (36/145) (0.46 s)  •••••——————————————— 26%
  Running "Increased education": 2004.01.01 (48/145) (0.63 s)  ••••••—————————————— 34%
  Running "Increased education": 2005.01.01 (60/145) (0.81 s)  ••••••••———————————— 42%
  Running "Increased education": 2006.01.01 (72/145) (0.97 s)  ••••••••••—————————— 50%
  Running "Increased education": 2007.01.01 (84/145) (1.13 s)  •••••••••••————————— 59%
  Running "Increased education": 2008.01.01 (96/145) (1.31 s)  •••••••••••••——————— 67%
  Running "Increased education": 2009.01.01 (108/145) (1.48 s)  •••••••••••••••————— 75%
  Running "Increased education": 2010.01.01 (120/145) (1.66 s)  ••••••••••••••••———— 83%
  Running "Increased education": 2011.01.01 (132/145) (1.84 s)  ••••••••••••••••••—— 92%
  Running "Increased education": 2012.01.01 (144/145) (2.02 s)  •••••••••••••••••••• 100%
Plot the resulting education levels.
[8]:
plt.plot(s0.results.timevec, s0.results.edu.mean_attainment, label=s0.label)
plt.plot(s1.results.timevec, s1.results.edu.mean_attainment, label=s1.label)
plt.ylabel('Average years of education among women')
plt.xlabel('Year')
plt.legend()
[8]:
<matplotlib.legend.Legend at 0x7de191c712d0>