SEIR and SEIRS models
In SEIR (Susceptible - Exposed - Infectious - Recovered) models, individuals experience a long incubation duration (the "exposed" category), such that the individual is infected but not yet infectious. For example, chicken pox and even vector-borne diseases such as dengue hemorrhagic fever have a long incubation duration where the individual cannot yet transmit the pathogen to others. If immunity wanes, the dynamics then become an SEIRS (Susceptible - Exposed - Infectious - Recovered - Susceptible) model as individuals once again become susceptible.
The SEIR/SEIRS diagram below shows how individuals move through each compartment in the model; the dashed line indicates how the SEIR model becomes an SEIRS model, where recovered people may become susceptible again (recovery does not confer lifelong immunity). For example, rotavirus and malaria are diseases with long incubation durations and only temporary immunity after recovery.
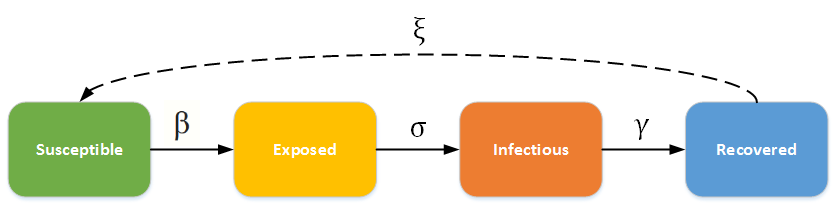
SEIR - SEIRS model
The infectious rate, \(\beta\), controls the rate of spread (probability of transmission between susceptible and infectious individuals); the incubation rate, \(\sigma\), is the rate at which latent individuals become infectious (average incubation duration is \(1/\sigma\)); the recovery rate, \(\gamma = 1/D\), is determined by the average duration \(D\) of infection; and for the SEIRS model, \(\xi\) is the rate at which recovered individuals return to the susceptible state due to loss of immunity. See the parameter table for a reference of all compartmental model parameters.
SEIR model
Many diseases have a latent phase during which the individual is infected but not yet infectious; this delay between the acquisition of infection and the infectious state can be incorporated within the SIR model by adding a latent/exposed population, \(E\), and letting infected (but not yet infectious) individuals move from \(S\) to \(E\) and from \(E\) to \(I\).
SEIR without vital dynamics
In a closed population with no births or deaths, the SEIR model becomes:
where \(N = S + E + I + R\) is the total population.
Since the latency delays the start of the individual's infectious period, the secondary spread from an infected individual will occur at a later time compared with an SIR model, which has no latency. Therefore, including a longer latency period will result in slower initial growth of the outbreak. However, since the model does not include mortality, the basic reproductive number, \(R_0 = \beta/\gamma\), does not change.
The complete course of an outbreak is observed: after the initial fast growth, the epidemic depletes the susceptible population, and eventually the virus cannot find enough new susceptible people and dies out; introducing the incubation period does not change the cumulative number of infected individuals.
The following plots show typical SEIR outbreaks with incubation periods of 8 days and 2 days; a shorter incubation period leads to a faster depletion of the susceptible population, but the cumulative number of infections remains the same.
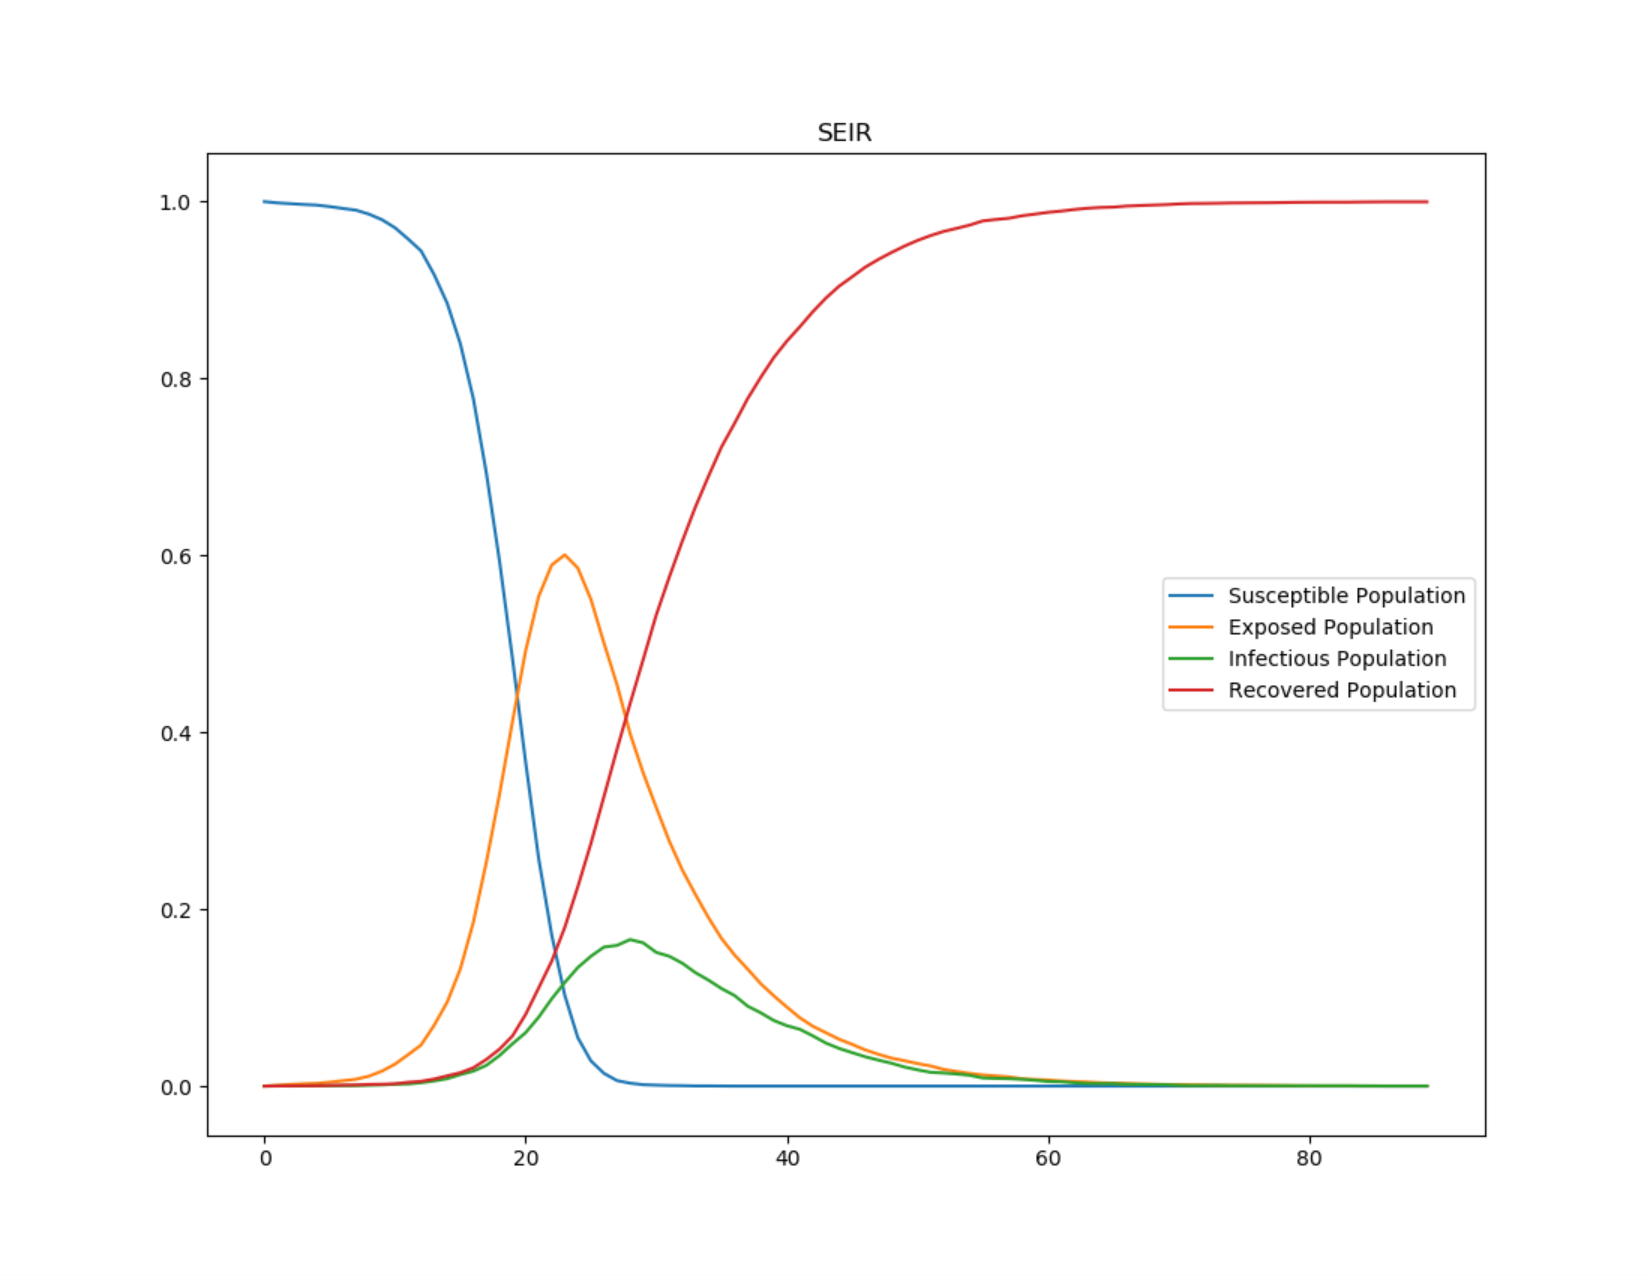
Figure 1: SEIR epidemic course for 8-day incubation period
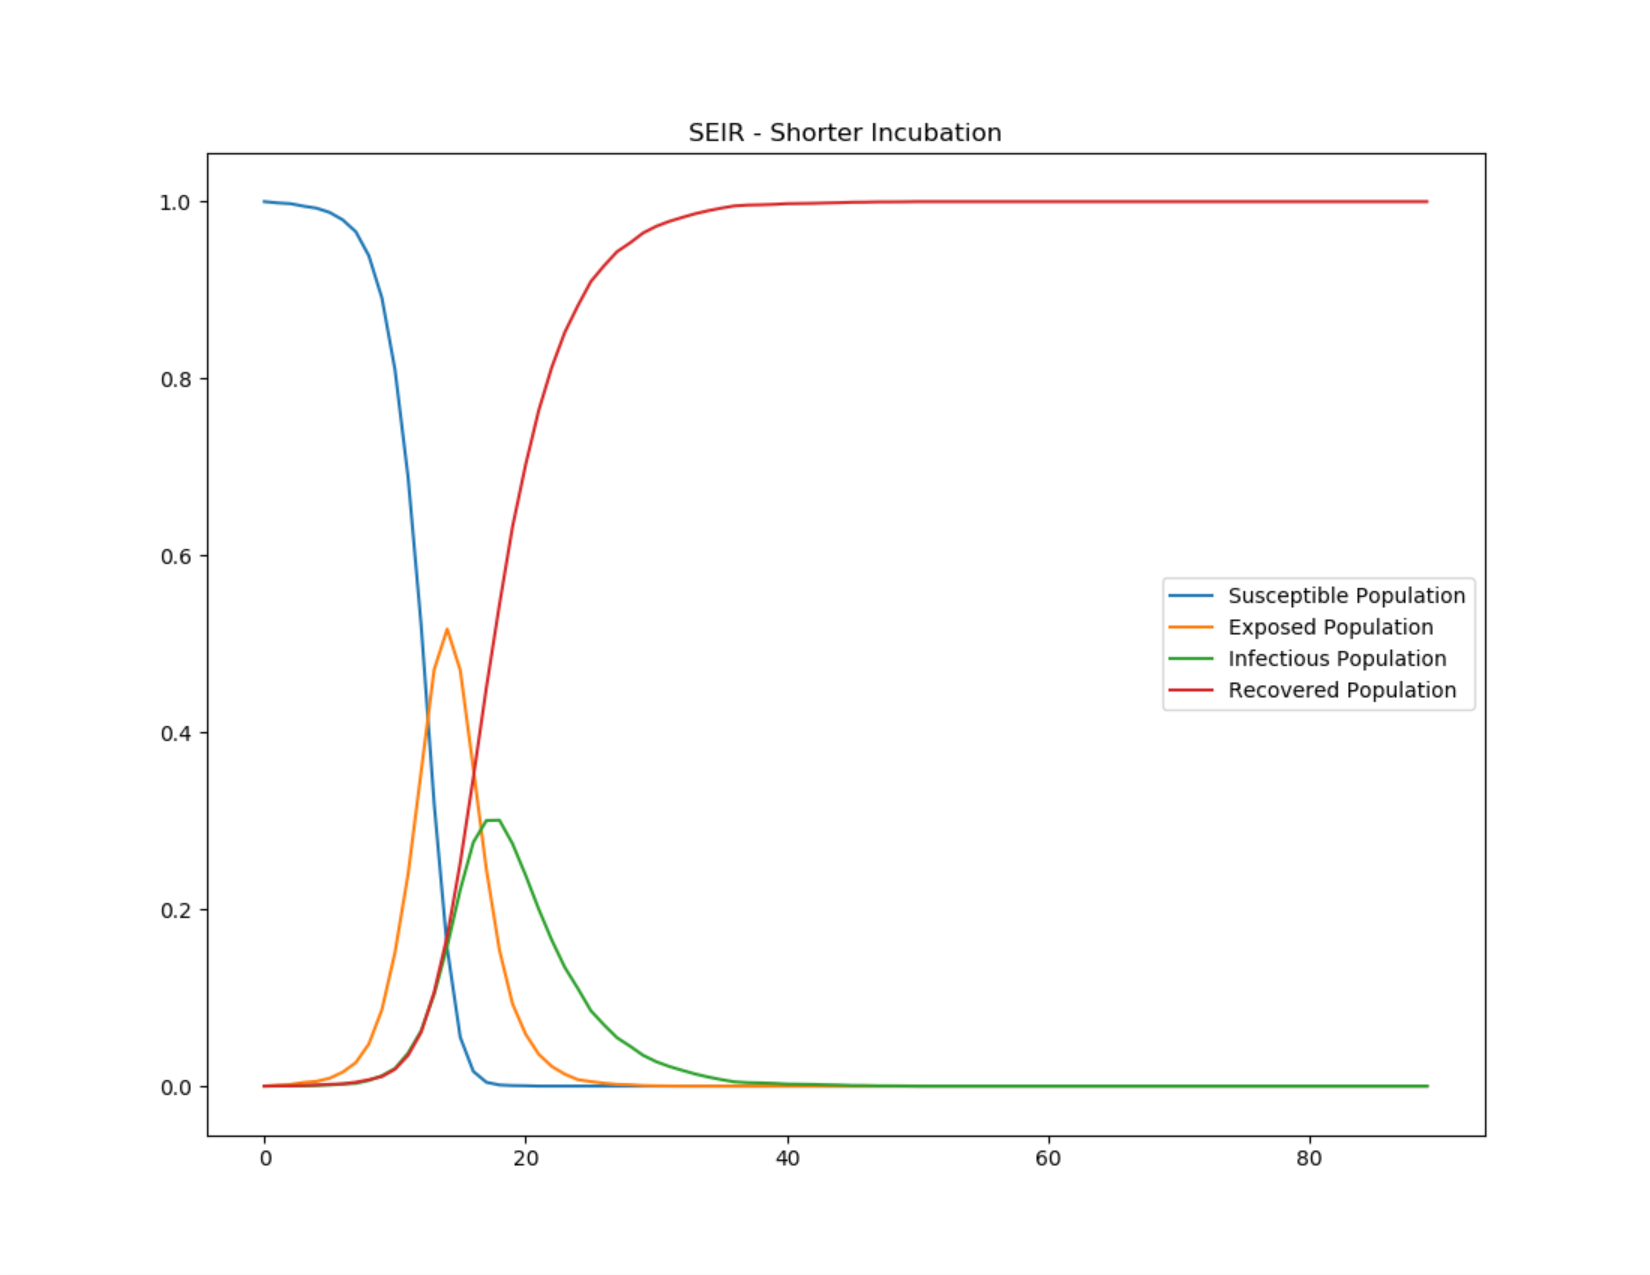
Figure 2: SEIR epidemic course for 2-day incubation period
SEIR with vital dynamics
As with the SIR model, enabling vital dynamics (births and deaths) can sustain an epidemic or allow new introductions to spread because new births provide more susceptible individuals. In a realistic population like this, disease dynamics will reach a steady state. Where \(\mu\) and \(\nu\) represent the birth and death rates, respectively, and are assumed to be equal to maintain a constant population, the ODE then becomes:
where \(N = S + E + I + R\) is the total population.
The following graphs show periodic reintroductions of an SEIR outbreak in a population with vital dynamics.
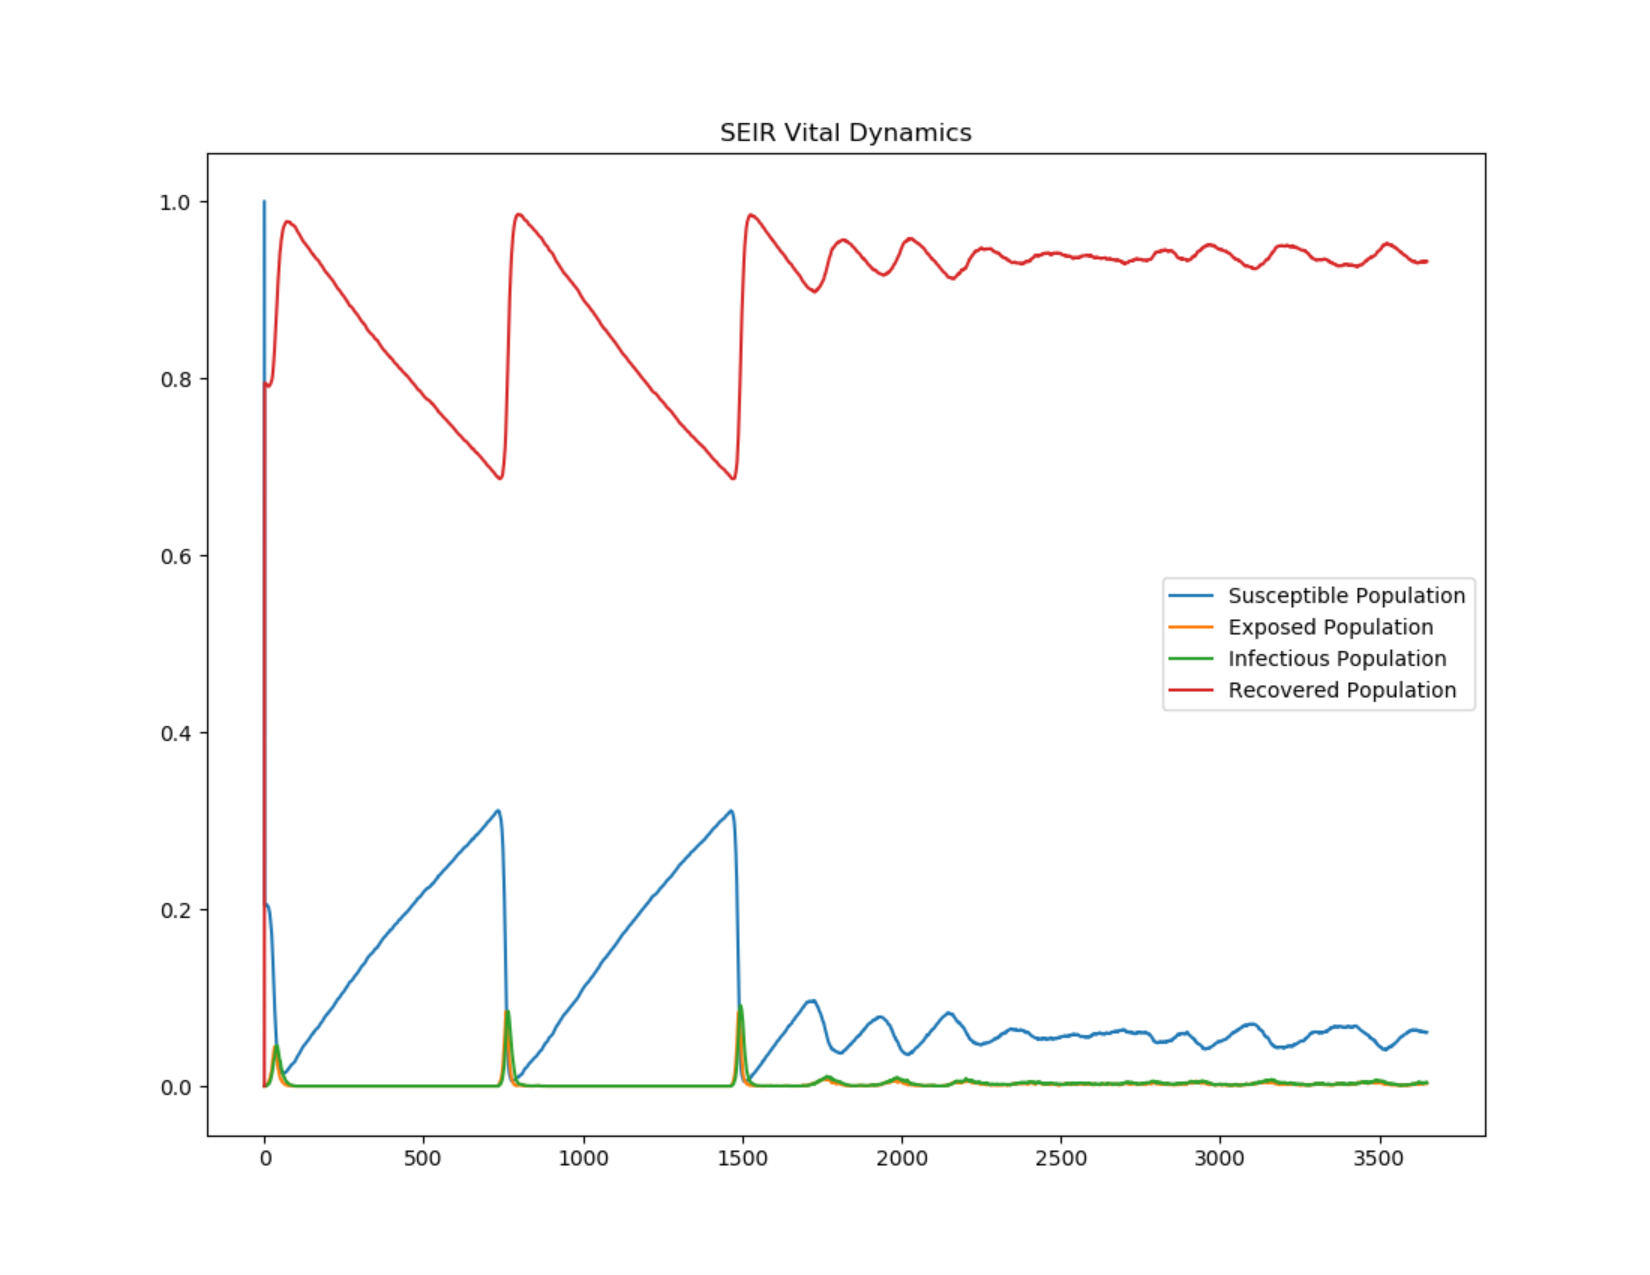
Figure 3: SEIR periodic outbreaks on reintroduction in a population with vital dynamics
SEIRS model
The SEIR model assumes people carry lifelong immunity to a disease upon recovery, but for many diseases, immunity after infection wanes over time. In this case, the SEIRS model is used to allow recovered individuals to return to a susceptible state; specifically, \(\xi\) is the rate at which recovered individuals return to the susceptible state due to loss of immunity. If there is sufficient influx to the susceptible population, at equilibrium the dynamics will be in an endemic state with damped oscillation. The SEIRS ODE is:
where \(N = S + E + I + R\) is the total population.
SEIRS with vital dynamics
You can also add vital dynamics to an SEIRS model, where \(\mu\) and \(\nu\) again represent the birth and death rates, respectively. To maintain a constant population, assume that \(\mu = \nu\). In steady state, \(\frac{dI}{dt} = 0\). The ODE then becomes:
where \(N = S + E + I + R\) is the total population.
The following plot shows the complete trajectory of a SEIRS outbreak with fatalities, illustrating disease endemicity due to vital processes and waning immunity, as well as the effect of vaccination campaigns that eradicate the outbreak after day 500.
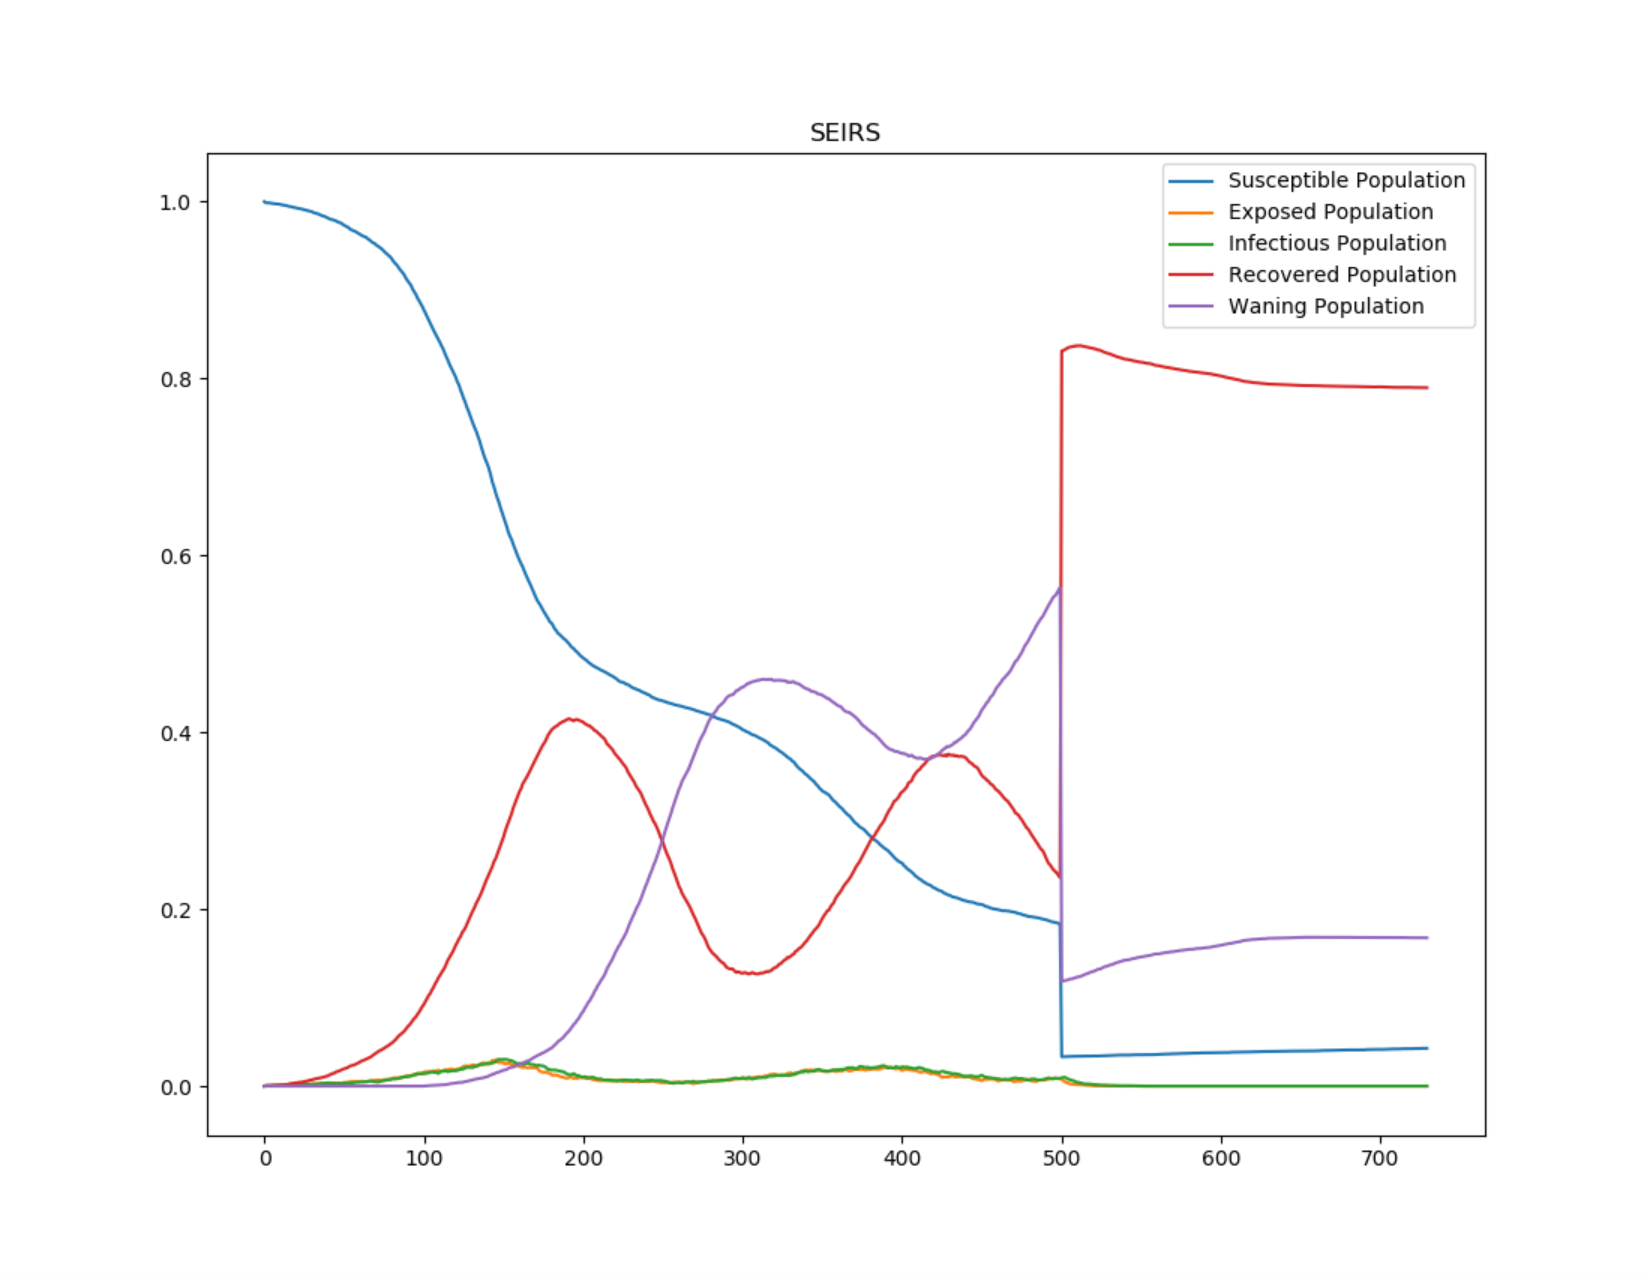
Figure 4: Trajectory of the SEIRS outbreak