Population density and transmission scaling#
Disease transmission depends on the rate effective contacts as represented by parameter \(\beta_0\). But what happens to the effective contact rate as the size of the population changes? There are two commonly accepted answers: frequency-dependent and density-dependent transmission scaling.
Frequency-dependent scaling#
By default, EMOD uses frequency-dependent transmission and the overall transmissibility does not change with population size or density. An infected individual will infect the same number of people either in a small village or in a metropolitan area. For this case,
so that the transmission rate inversely proportional to \(N(t)\). The dynamics are frequency- dependent because the \(\beta_0\) parameter is divided by the current node population, \(N(t)\).
Density-dependent scaling#
However, when population size is low it’s possible that the transmissibility might be lower and follow density-dependent behavior. Think of a room containing \(N\) individuals. A single highly-infectious cough would infect more people if the number of people in the room (population density) was higher. The number of effective contacts per person per time is proportional to the population. For this case,
Usually, the denominator is taken as \(N(t=0)\), the initial node population. Note that the transmission rate per capita is a constant in this case. Density-dependent transmission is often found in SIR models, which inherently neglect the total population size.
Saturating function of population density#
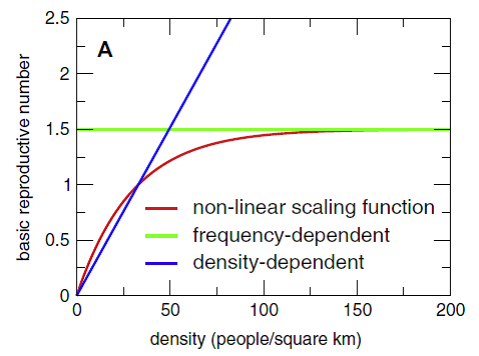
Based on existing evidence, it is possible that neither a frequency-dependent nor a density- dependent mechanism may adequately describe the correct scaling over the entire population density spectrum, but that more closely follows a non-linear scaling function. That is, contact rates tend to increase with density but saturate at high densities. EMOD allows the transmission rate to scale as a saturating function of population density. The force of infection contributed by each infected individual under these two cases of transmission scaling are as follows:
Here, \(\rho\) is the population density and \(\rho_{50}\) is an input parameter the governs the transition from density to frequency dependence. The population density is computed as \(\rho =\frac{N}{A}\) where \(A\) is is the area of the node. This node area is in turn computed from the longitude and latitude of the node center point (from the demographics file) and the node size. It is assumed that all nodes have equal size in terms of the degrees of latitude and longitude, as determined by configuration parameter Node_Grid_Size. Denoting this node grid size by \(w\), the area of a node located at (lat, long) is computed based on the corresponding area of a sphere,
where \(R=6371.2213\) km is the radius of Earth.
The saturating function of density is enabled by setting the EMOD configuration parameter Population_Density_Infectivity_Correction to SATURATING_FUNCTION_OF_DENSITY. Finally, the \(\rho_{50}\) parameter is configured using the configuration parameter Population_Density_C50. For more information, see Infectivity and transmission parameters.
This is described in more detail in the article The scaling of contact rates with population density for the infectious disease models, by Hu et al., 2013 Mathematical Biosciences. 244(2):125-134. See the figure from that article below.

Figure 1: Effect of population density on transmissibility#
The Generic/DensityScaling example scenario in the EMOD scenarios zip file illustrates how population density can be configured to affect transmission. Review the README files there for more information.
The table below shows how setting Node_Grid_Size in that scenario to 0.1, 0.15, and 0.3 affects population density and R0 values.
Simulation |
Population |
Latitude, Longitude |
Node_Grid_Size |
Node Area |
Density |
R0 |
|---|---|---|---|---|---|---|
1 |
10,000 |
0, 0 |
0.1 |
124 |
80 |
R0> 1 |
2 |
10,000 |
0, 0 |
0.15 |
278 |
36 |
R0~ 1 |
3 |
10,000 |
0, 0 |
0.3 |
1112 |
9 |
R0< 1 |
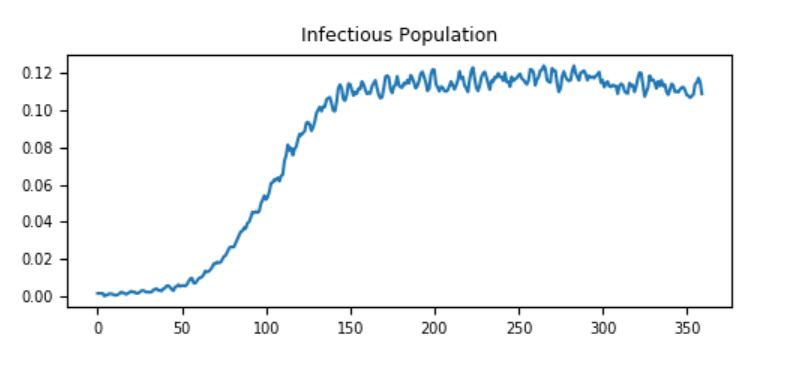
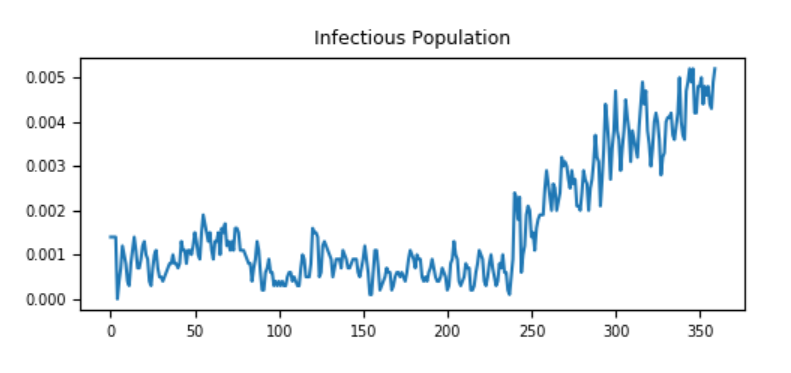
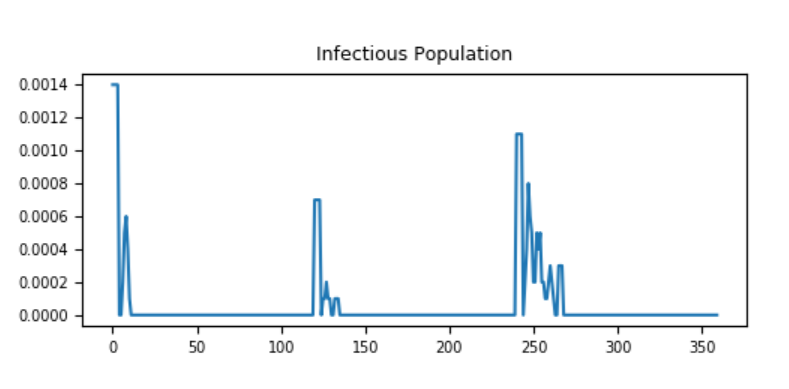
The following graphs show the effect of population density on transmissibility, in terms of maintaining endemic status. When population density is large enough, it is easy to maintain an endemic status while in lower density is difficult to do so.

Figure 2: Node_Grid_Size = 0.1, population density 80/km2and R0 > 1#

Figure 3: Node_Grid_Size = 0.15, population density 36/km2and R0 ~ 1#

Figure 4: Node_Grid_Size = 0.3, population density 9/km2and R0 < 1#
