Overview#
Welcome to the IDM Vis-Tools visualization tool set. This page will provide an overview of the structure of Vis-Tools and the inter-operation of its parts. The following pages will provide information on the use of Vis-Tools for advanced simulation data visualization.
Structure#
Vis-Tools can be invoked either from the COMPS web client or for more advanced use, run on your local computer. When used standalone, the Vis-Tools files can reside wherever convenient.
Vis-Tools consists of two main parts - a Python package that allows you to preprocess EMOD simulation inputs and outputs into a “visset” file, and a browser-based client to allow visualization of the simulation data. For standalone use, Vis-Tools also contains a simple Python web server that you run to serve up the HTML visualization component.
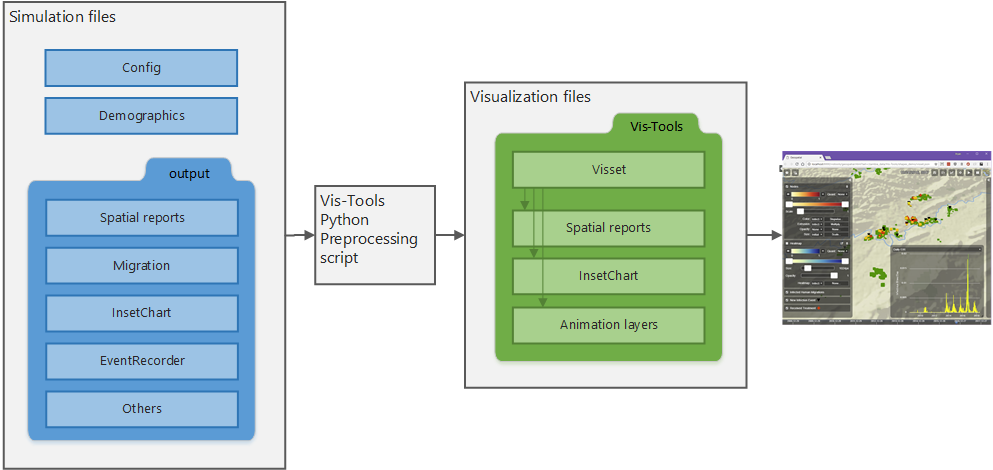
Structure of Vis-Tools.#
COMPS usage#
For spatial simulations run within the COMPS system, Vis-Tools can be invoked from the Spatial tab of COMPS’ explore view.
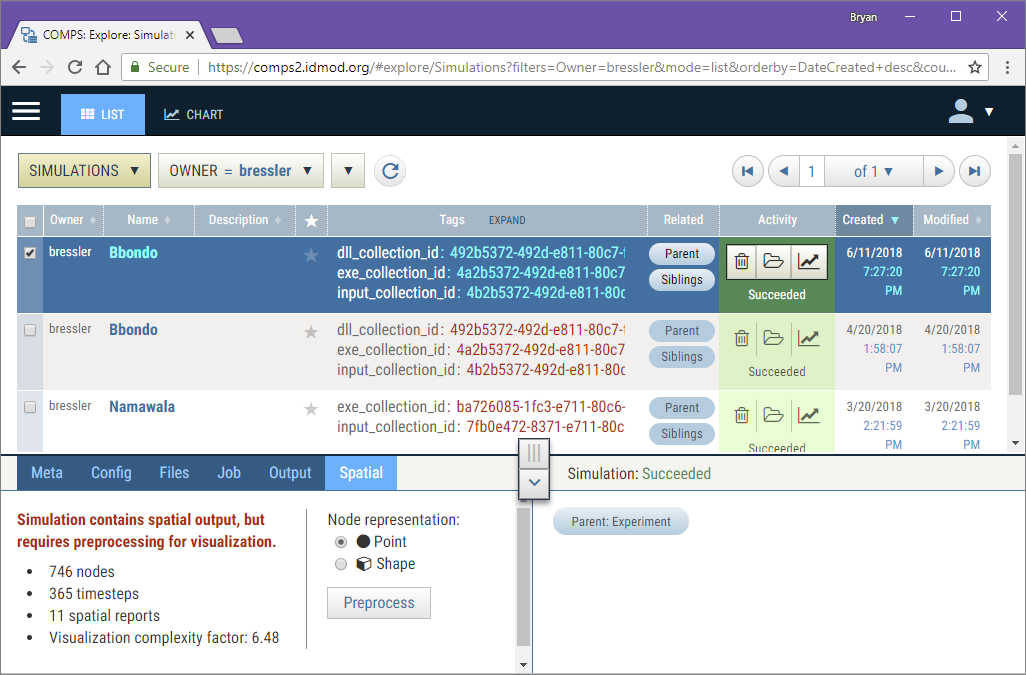
COMPS Explore view with Spatial tab showing in details.#
For more information about running Vis-Tools from COMPS, see the Quickstart.
Python preprocessing#
The Vis-Tools visualization client uses a visset file that describes how the simulation data is to be displayed and contains a subset of the simulation’s demographics data (specifically, information about its nodes). The visset file is obtained by running a preprocessing script on your simulation’s input and output files.
You can write this preprocessing script from scratch, but more likely you’ll let
Vis-Tools create one for you. The Vis-Tools survey program can look at your input and
output files and create a default preprocessing script to get you started.
The preprocessing script will have at least one output, which is the visset JSON file. That file will likely reference files in your simulation’s output folder as well.
Visset#
The visset file contains references to all the files necessary to visualize your simulation. It also includes the default settings for the visualization client page. If you so desire, you can have more than one visset for your simulation, perhaps to highlight different aspects of the simulation’s output.
Local web server#
If you are running Vis-Tools standalone, the data to be visualized will already be on your local computer. In order to serve that data up to the visualization client, Vis-Tools contains a simple Python web server. This web server is by default on port 8000 of your own computer, “localhost”.
Clients#
Vis-Tools is designed to support multiple visualization clients. Currently, however, there is only one client, called “Geospatial,” which is primarily designed for the visualization of spatio-temporal simulation output. In the future other clients will be provided for different data visualization scenarios.