Geospatial#
This section describes in detail the Vis-Tools Geospatial visualization client. It allows you to visualize simulation inputs and outputs on a 3D globe of earth. The client affords lots of flexibility to give you control over just how your data is displayed.
Note
Vis-Tools is built to support multiple visualization clients, based on whatever technology is best for the task at hand. The first visualization client is oriented towards geospatial data, but subsequent versions of Vis-Tools will feature other clients for other visualization scenarios.
Running the Geospatial client#
Running from COMPS#
To use the Geospatial client from COMPS, locate a spatial simulation in COMPS Explore view and click on the Spatial tab of the Details pane. To run the Vis-Tools Geospatial client, click the Visualize button.
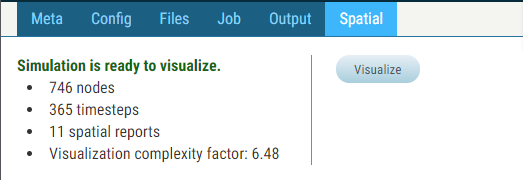
For more details on using Vis-Tools from COMPS, see Running Vis-Tools from COMPS.
Running standalone#
To use the Geospatial client, run the Vis-Tools Python web server as described in Start the web server. The web server will automatically launch the Geospatial client to display demo data. The next section describes how to point the client at other data.
URL and visset#
The data displayed by the Geospatial client is controlled by a URL parameter. Here is the default URL dispatched by the Vis-Tools Python web server:
http://localhost:8000/vistools/geospatial.html?set=/zambia_data/Vis-Tools/shapes_demo/visset.json
Within that URL, note the set=/zambia_data/Vis-Tools/shapes_demo/visset.json.
That is URL parameter that tells the client which data to load. If you had a set
of preprocessed data (see Preprocess sim data) in a directory called my_sim within
the Vis-Tools directory, you would typically use an URL like:
http://localhost:8000/geospatial.html?set=/my_sim/Vis-Tools/.../visset.json
(Where “…” represents the hexadecimal hash directory created by Vis-Tools’s
survey program.)
Note
You can bookmark your customized URL for faster access. Bookmarks to simulations you create with standalone Vis-Tools will work as long as the Vis-Tools Python web server is running. Bookmarks to simulations you’ve preprocessed in COMPS will work any time.
Tip
The Visualize button in COMPS is actually a link. You can Ctrl-click it to open the Geospatial visualization in a new tab, or right-click it to copy the URL or bookmark it.
You can in fact have as many vissets in your simulation directory as you want. You might do that in order to have customized vissets for demonstrating various aspects of your simulation. See the section Finish preprocessing in Components of a preprocessing script to see how to write out vissets with different names.