How to use dashboard for managing simulations#
The dashboard shows numerous graphs and breakdowns that help to visualize who’s using which resources and when. These graphs break down the amount of space used by each user and on what day, as well as the time spent using the cluster. These metrics facilitate team management of disk space limitations and time usage.
Use dashboard for managing simulations#
From the dashboard view in COMPS, you can view and analyze the following:
Simulations Currently in Queue
Workflows Currently Processing
Core Processing Time Consumed
Home Disk Space in Use
Simulations Processed per Owner
Cluster Disk Space in Use
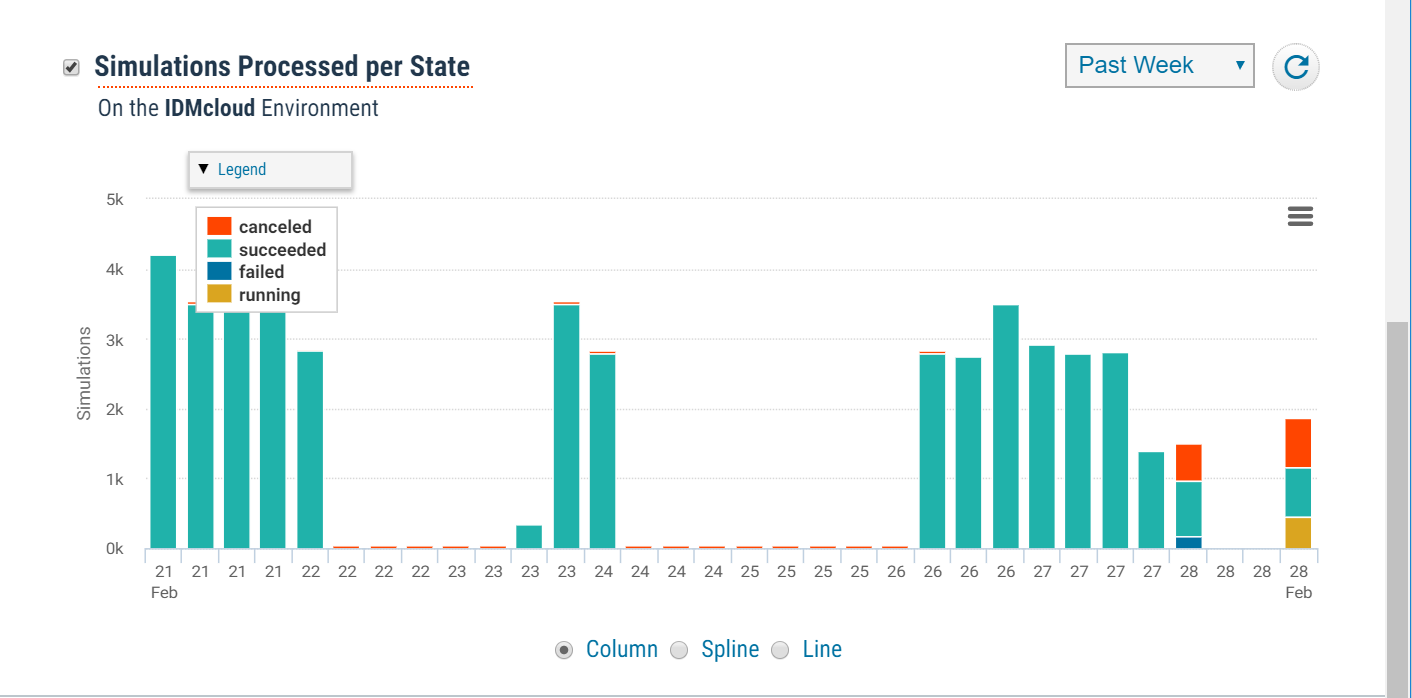
Simulations Processed per State
Simulations Processed per Node Group
Follow the steps below to use dashboard for managing simulations.
On the top left corner of COMPS, click the hamburger icon.
Click Dashboard.
The following is an example of Simulations Processed per State (canceled, succeeded, failed, running).