How to view weather data visualizations#
COMPS includes spatial and temporal weather data from satellite data and weather station readings. This includes air temperature, relative humidity, and rainfall for many geographic regions across the globe.
View weather data visualizations#
Follow the steps below to view weather data visualizations.
On the top left corner of COMPS, click the hamburger icon.
Click Create, click Model Input Files.
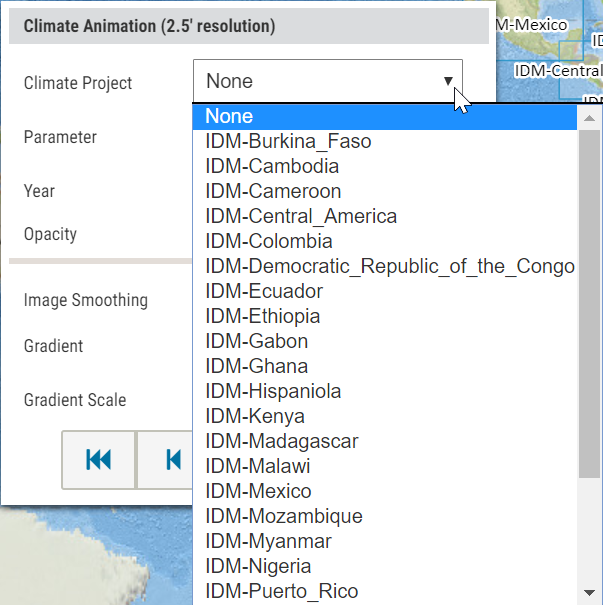
Click drop down arrow for Climate Project.
Select one of the available IDM climate projects.
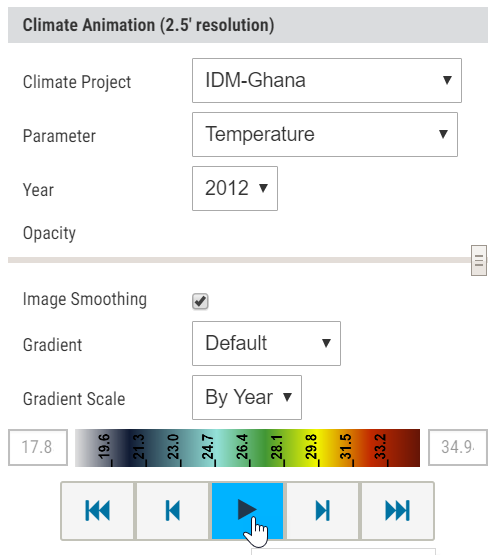
Choose a Parameter type for visualization and then select a Year. In this example, IDM-Ghana, Temperature, and 2012 were selected.
Click the play button:
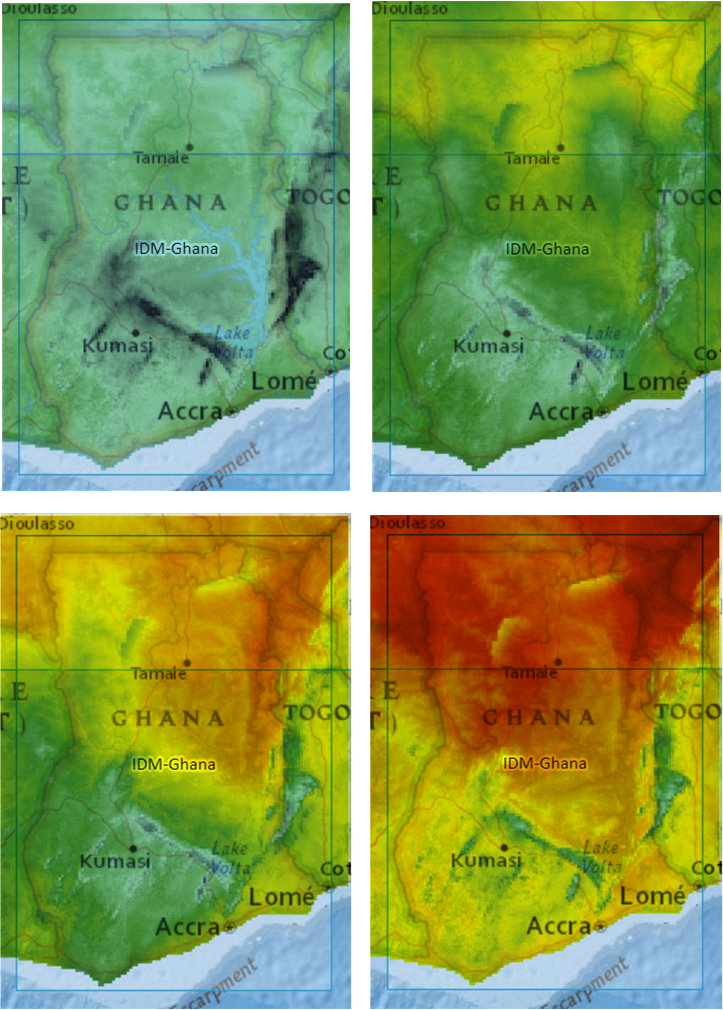
You can then view the animated visualization over time of the parameter, such as temperature, overlaid on top of the selected climate project region:
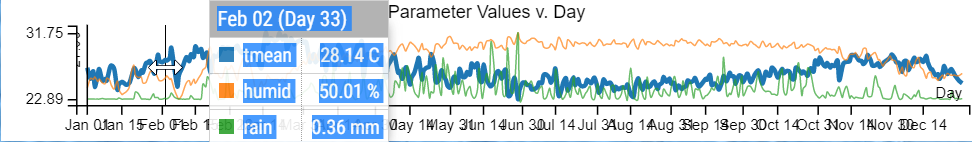
You can also view and analyze the generated graph with data for the mean temperature, humidity, and rainfall: