Multi-chart views of simulations#
COMPS allows you to create a chart of the results from your completed simulations for comparison and analysis.
Create multi-chart views#
Follow the steps below to create multi-chart views of simulations.
On the top left corner of COMPS, click the hamburger icon.
Click Explore, and then click Simulations. Select the succeeded simulations you would like to chart.
Note
You can also create multi-chart views under Experiments by selecting an experiment, clicking on Succeeded, and then clicking Chart.
On the top, click Chart.

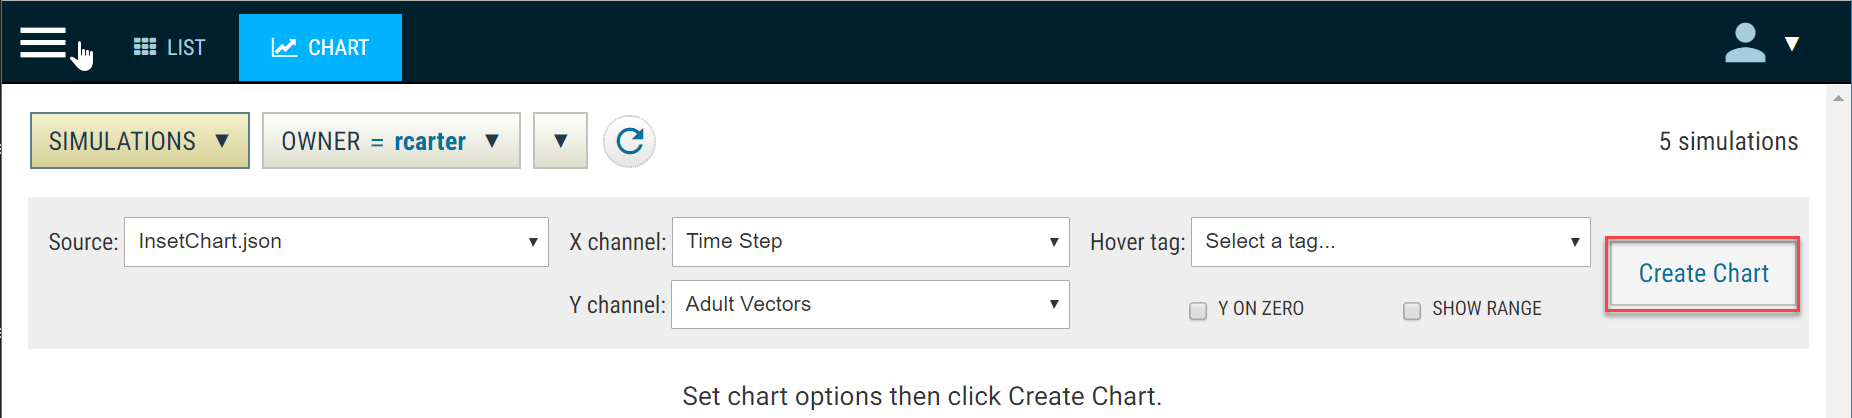
Accept the defaults and click Create Chart.
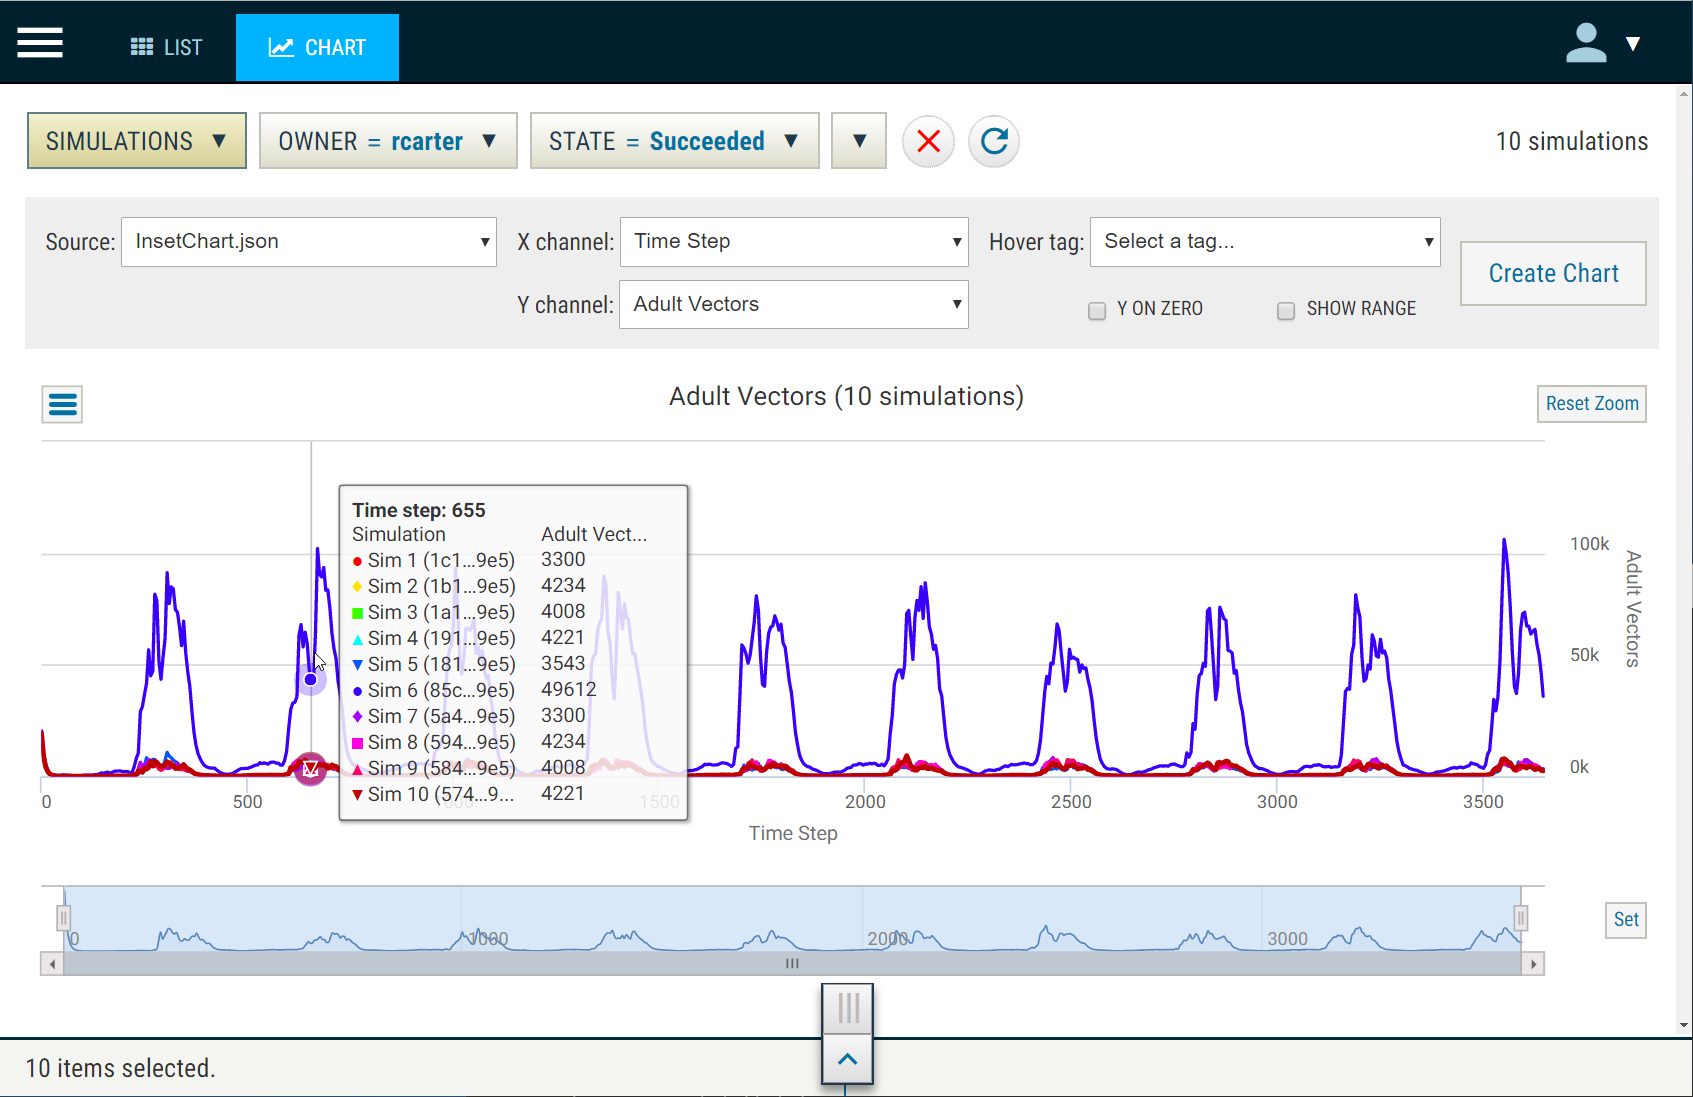
You can then compare and begin analysis of the results of your simulations.
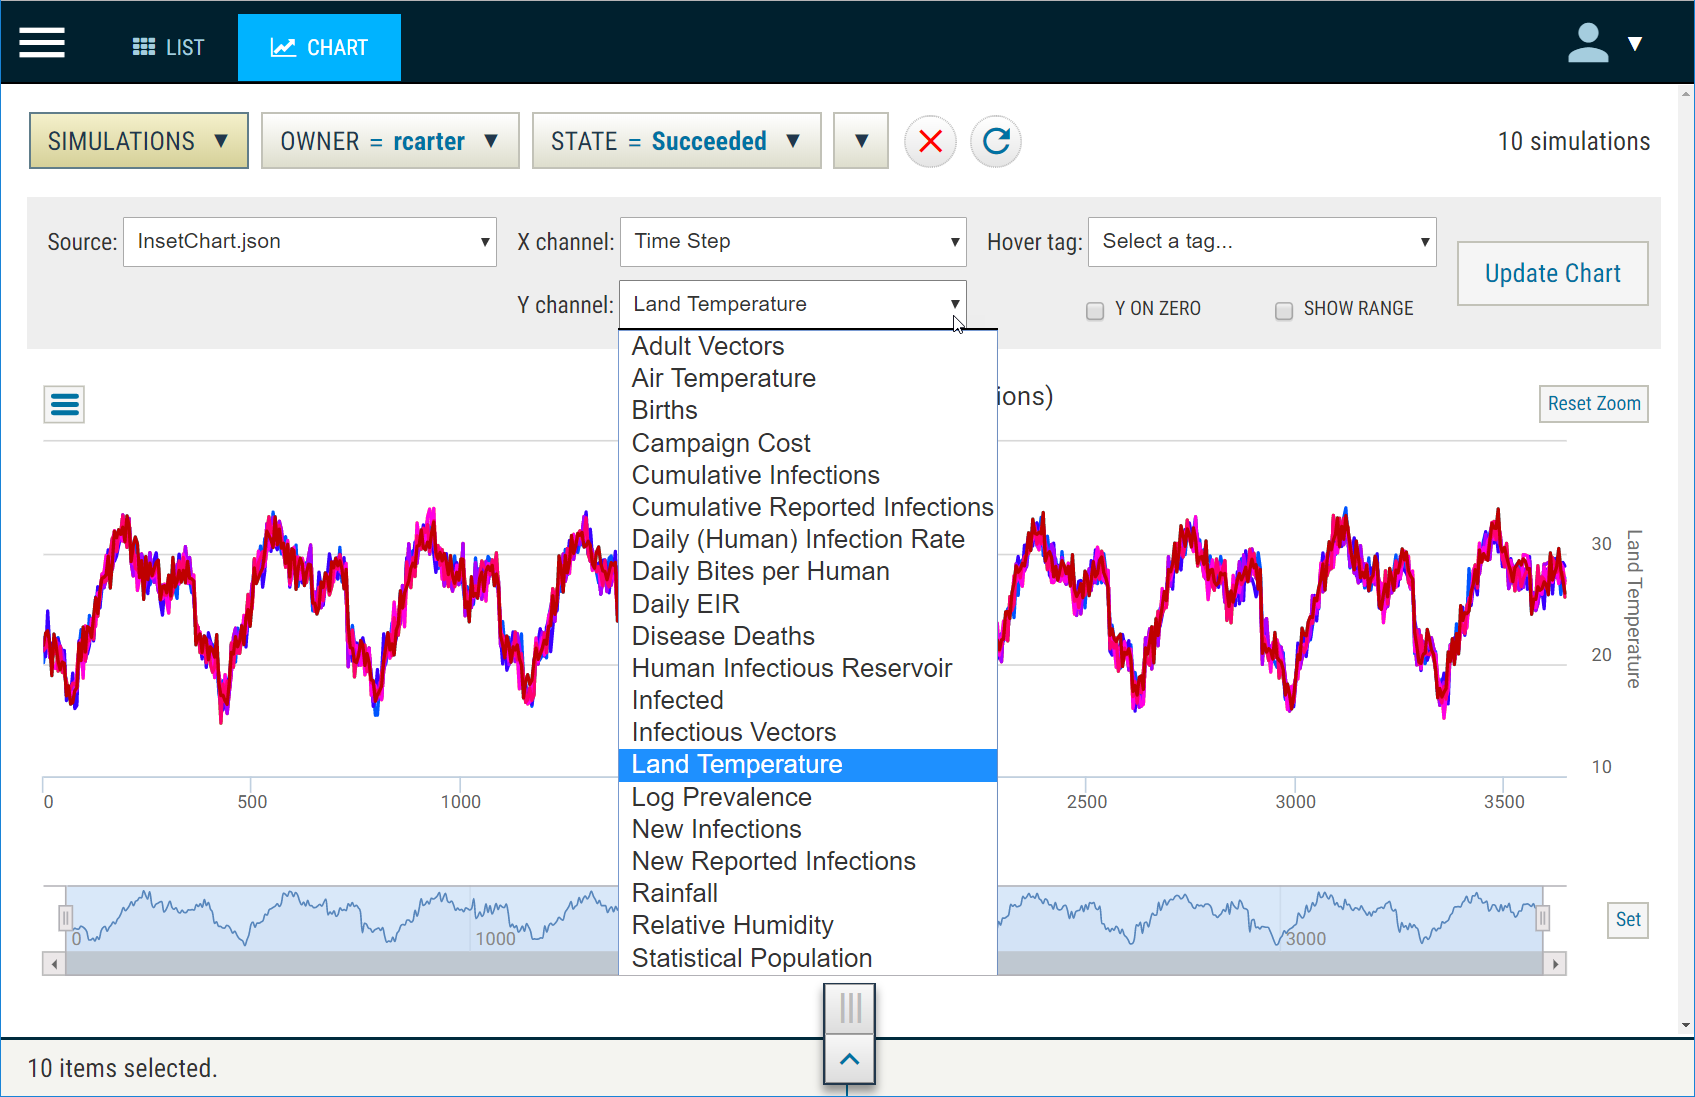
You can also select different parameters for charting analysis.