T1 - Getting started#
Installing and getting started with Covasim is quite simple.
To install, just type pip install covasim. If it worked, you should be able to import Covasim with import covasim as cv.
The basic design philosophy of Covasim is: common tasks should be simple. For example:
Defining parameters
Running a simulation
Plotting results
This tutorial walks you through how to do these things.
Click here to open an interactive version of this notebook.
Hello world#
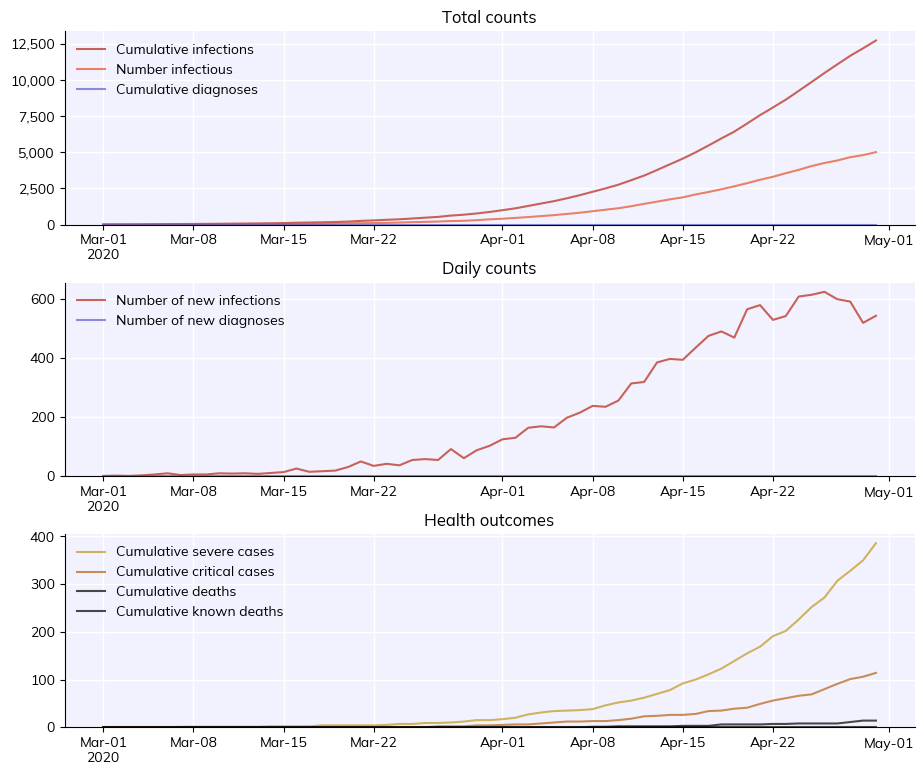
To create, run, and plot a sim with default options is just:
[1]:
import covasim as cv

sim = cv.Sim()
sim.run()
fig = sim.plot()
Covasim 3.1.7 (2026-02-18) — © 2020-2026 by IDM
Initializing sim with 20000 people for 60 days
  Running 2020-03-01 ( 0/60) (0.10 s)  ———————————————————— 2%
  Running 2020-03-11 (10/60) (0.13 s)  •••————————————————— 18%
  Running 2020-03-21 (20/60) (0.16 s)  ••••••—————————————— 34%
  Running 2020-03-31 (30/60) (0.20 s)  ••••••••••—————————— 51%
  Running 2020-04-10 (40/60) (0.33 s)  •••••••••••••——————— 67%
  Running 2020-04-20 (50/60) (0.38 s)  ••••••••••••••••———— 84%
  Running 2020-04-30 (60/60) (0.44 s)  •••••••••••••••••••• 100%

Simulation summary:
       12,730 cumulative infections
          596 cumulative reinfections
       10,182 cumulative infectious
        6,395 cumulative symptomatic cases
          386 cumulative severe cases
          114 cumulative critical cases
        5,159 cumulative recoveries
           14 cumulative deaths
            0 cumulative tests
            0 cumulative diagnoses
            0 cumulative known deaths
            0 cumulative quarantined people
            0 cumulative isolated people
            0 cumulative vaccine doses
            0 cumulative vaccinated people
Defining parameters and running simulations#
Parameters are defined as a dictionary. The most common parameters to modify are the population size, the initial number of people infected, and the start and end dates of the simulation. We can define those as:
[2]:
pars = dict(
    pop_size = 50e3,
    pop_infected = 100,
    start_day = '2020-04-01',
    end_day = '2020-06-01',
)
Running a simulation is pretty easy. In fact, running a sim with the parameters we defined above is just:
[3]:
sim = cv.Sim(pars)
sim.run()
Initializing sim with 50000 people for 61 days
  Running 2020-04-01 ( 0/61) (0.21 s)  ———————————————————— 2%
  Running 2020-04-11 (10/61) (0.28 s)  •••————————————————— 18%
  Running 2020-04-21 (20/61) (0.35 s)  ••••••—————————————— 34%
  Running 2020-05-01 (30/61) (0.43 s)  ••••••••••—————————— 50%
  Running 2020-05-11 (40/61) (0.54 s)  •••••••••••••——————— 66%
  Running 2020-05-21 (50/61) (0.69 s)  ••••••••••••••••———— 82%
  Running 2020-05-31 (60/61) (0.86 s)  •••••••••••••••••••— 98%
Simulation summary:
       41,466 cumulative infections
        3,679 cumulative reinfections
       36,997 cumulative infectious
       24,043 cumulative symptomatic cases
        1,542 cumulative severe cases
          475 cumulative critical cases
       24,320 cumulative recoveries
           86 cumulative deaths
            0 cumulative tests
            0 cumulative diagnoses
            0 cumulative known deaths
            0 cumulative quarantined people
            0 cumulative isolated people
            0 cumulative vaccine doses
            0 cumulative vaccinated people
[3]:
Sim(<no label>; 2020-04-01 to 2020-06-01; pop: 50000 random; epi: 41466⚙, 86☠)
This will generate a results dictionary sim.results. For example, the number of new infections per day is sim.results['new_infections'].
Rather than creating a parameter dictionary, any valid parameter can also be passed to the sim directly. For example, exactly equivalent to the above is:
[4]:
sim = cv.Sim(pop_size=50e3, pop_infected=100, start_day='2020-04-01', end_day='2020-06-01')
sim.run()
Initializing sim with 50000 people for 61 days
  Running 2020-04-01 ( 0/61) (0.22 s)  ———————————————————— 2%
  Running 2020-04-11 (10/61) (0.28 s)  •••————————————————— 18%
  Running 2020-04-21 (20/61) (0.35 s)  ••••••—————————————— 34%
  Running 2020-05-01 (30/61) (0.43 s)  ••••••••••—————————— 50%
  Running 2020-05-11 (40/61) (0.54 s)  •••••••••••••——————— 66%
  Running 2020-05-21 (50/61) (0.69 s)  ••••••••••••••••———— 82%
  Running 2020-05-31 (60/61) (0.86 s)  •••••••••••••••••••— 98%
Simulation summary:
       41,466 cumulative infections
        3,679 cumulative reinfections
       36,997 cumulative infectious
       24,043 cumulative symptomatic cases
        1,542 cumulative severe cases
          475 cumulative critical cases
       24,320 cumulative recoveries
           86 cumulative deaths
            0 cumulative tests
            0 cumulative diagnoses
            0 cumulative known deaths
            0 cumulative quarantined people
            0 cumulative isolated people
            0 cumulative vaccine doses
            0 cumulative vaccinated people
[4]:
Sim(<no label>; 2020-04-01 to 2020-06-01; pop: 50000 random; epi: 41466⚙, 86☠)
You can mix and match too – pass in a parameter dictionary with default options, and then include other parameters as keywords (including overrides; keyword arguments take precedence). For example:
[5]:
sim = cv.Sim(pars, pop_infected=10) # Use parameters defined above, except start with 10 infected people
sim.run()
Initializing sim with 50000 people for 61 days
  Running 2020-04-01 ( 0/61) (0.21 s)  ———————————————————— 2%
  Running 2020-04-11 (10/61) (0.27 s)  •••————————————————— 18%
  Running 2020-04-21 (20/61) (0.34 s)  ••••••—————————————— 34%
  Running 2020-05-01 (30/61) (0.40 s)  ••••••••••—————————— 50%
  Running 2020-05-11 (40/61) (0.47 s)  •••••••••••••——————— 66%
  Running 2020-05-21 (50/61) (0.55 s)  ••••••••••••••••———— 82%
  Running 2020-05-31 (60/61) (0.65 s)  •••••••••••••••••••— 98%
Simulation summary:
       10,392 cumulative infections
          128 cumulative reinfections
        6,710 cumulative infectious
        4,185 cumulative symptomatic cases
          195 cumulative severe cases
           51 cumulative critical cases
        2,473 cumulative recoveries
            7 cumulative deaths
            0 cumulative tests
            0 cumulative diagnoses
            0 cumulative known deaths
            0 cumulative quarantined people
            0 cumulative isolated people
            0 cumulative vaccine doses
            0 cumulative vaccinated people
[5]:
Sim(<no label>; 2020-04-01 to 2020-06-01; pop: 50000 random; epi: 10392⚙, 7☠)
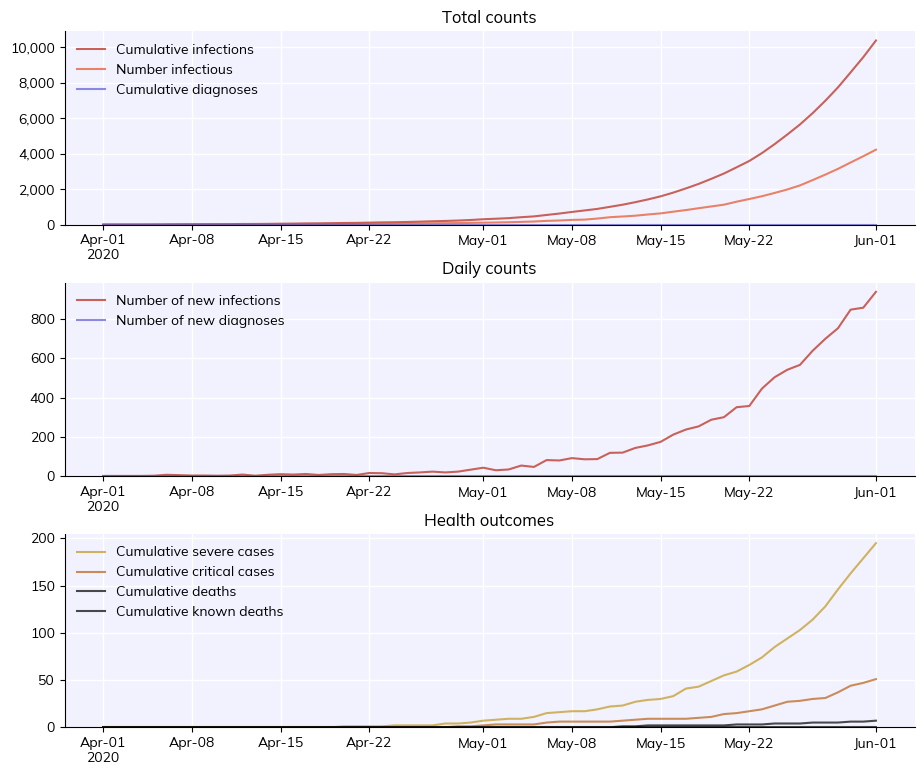
Plotting results#
As you saw above, plotting the results of a simulation is rather easy too:
[6]:
fig = sim.plot()
Full usage example#
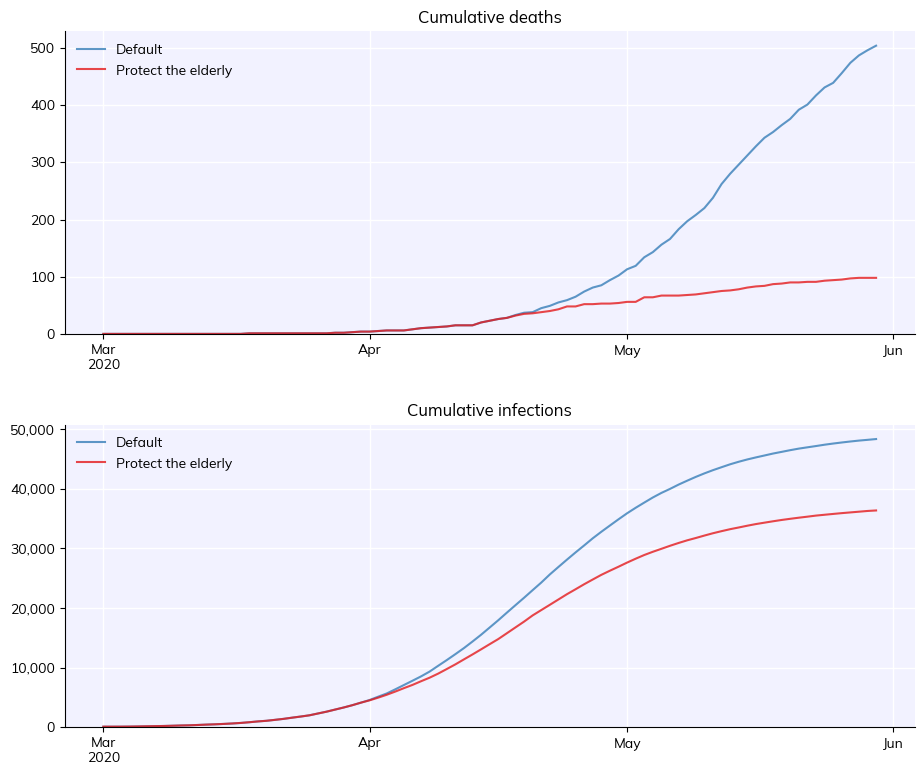
Many of the details of this example will be explained in later tutorials, but to give you a taste, here’s an example of how you would run two simulations to determine the impact of a custom intervention aimed at protecting the elderly.
[7]:
import covasim as cv

# Custom intervention -- see Tutorial 5
def protect_elderly(sim):
    if sim.t == sim.day('2020-04-01'):
        elderly = sim.people.age>70
        sim.people.rel_sus[elderly] = 0.0

pars = dict(
    pop_type = 'hybrid', # Use a more realistic population model
    location = 'japan', # Use population characteristics for Japan
    pop_size = 50e3, # Have 50,000 people total in the population
    pop_infected = 100, # Start with 100 infected people
    n_days = 90, # Run the simulation for 90 days
    verbose = 0, # Do not print any output
)

# Running with multisims -- see Tutorial 3
s1 = cv.Sim(pars, label='Default')
s2 = cv.Sim(pars, interventions=protect_elderly, label='Protect the elderly')
msim = cv.MultiSim([s1, s2])
msim.run()
fig = msim.plot(['cum_deaths', 'cum_infections'])