T1 - Getting started#
Installing and getting started with HPVsim is quite simple.
HPVsim is a Python package that can be pip-installed by typing pip install hpvsim into a terminal. You can then check that the installation was successful by importing HPVsim with import hpvsim as hpv.
The basic design philosophy of HPVsim is: common tasks should be simple. For example:
Defining parameters
Running a simulation
Plotting results
This tutorial walks you through how to do these things.
Click here to open an interactive version of this notebook.
Getting started#
To create, run, and plot a sim with default options is just:
[1]:
import hpvsim as hpv

sim = hpv.Sim()
sim.run()
fig = sim.plot()
HPVsim 2.1.0 (2025-03-25) — © 2023-2025 by IDM
Warning: metadata not available; not checking version:
No such file "/home/docs/checkouts/readthedocs.org/user_builds/institute-for-disease-modeling-hpvsim/envs/latest/lib/python3.13/site-packages/hpvsim/data/files/metadata.json". Use "string" argument or "fromfile=False" if loading a JSON string rather than a file.
Loading location-specific demographic data for "nigeria"
Initializing sim with 20000 agents
Loading location-specific data for "nigeria"
  Running 1995.0 ( 0/144) (1.28 s)  ———————————————————— 1%
  Running 1997.5 (10/144) (1.44 s)  •——————————————————— 8%
  Running 2000.0 (20/144) (1.61 s)  ••—————————————————— 15%
  Running 2002.5 (30/144) (1.77 s)  ••••———————————————— 22%
  Running 2005.0 (40/144) (1.95 s)  •••••——————————————— 28%
  Running 2007.5 (50/144) (2.12 s)  •••••••————————————— 35%
  Running 2010.0 (60/144) (2.30 s)  ••••••••———————————— 42%
  Running 2012.5 (70/144) (2.48 s)  •••••••••——————————— 49%
  Running 2015.0 (80/144) (2.67 s)  •••••••••••————————— 56%
  Running 2017.5 (90/144) (2.87 s)  ••••••••••••———————— 63%
  Running 2020.0 (100/144) (3.08 s)  ••••••••••••••—————— 70%
  Running 2022.5 (110/144) (3.29 s)  •••••••••••••••————— 77%
  Running 2025.0 (120/144) (3.51 s)  ••••••••••••••••———— 84%
  Running 2027.5 (130/144) (3.74 s)  ••••••••••••••••••—— 91%
  Running 2030.0 (140/144) (3.97 s)  •••••••••••••••••••— 98%
Simulation summary:
     824,814,324 total HPV infections
         512,386 total cancers
         275,606 total cancer deaths
            4.82 mean HPV prevalence (%)
           14.72 mean cancer incidence (per 100k)
           33.14 mean age of infection (years)
           46.65 mean age of cancer (years)
           49.93 mean age of cancer death (years)
Defining parameters and genotypes, and running simulations#
Parameters are defined as a dictionary. Some common parameters to modify are the number of agents in the simulation, the genotypes to simulate, and the start and end dates of the simulation. We can define those as:
[2]:
pars = dict(
    n_agents = 10e3,
    genotypes = [16, 18, 'hr'], # Simulate genotypes 16 and 18, plus all other high-risk HPV genotypes pooled together
    start = 1980,
    end = 2030,
)
Running a simulation is pretty easy. In fact, running a sim with the parameters we defined above is just:
[3]:
sim = hpv.Sim(pars)
sim.run()
Loading location-specific demographic data for "nigeria"
Initializing sim with 10000 agents
Loading location-specific data for "nigeria"
  Running 1980.0 ( 0/204) (0.02 s)  ———————————————————— 0%
  Running 1982.5 (10/204) (0.14 s)  •——————————————————— 5%
  Running 1985.0 (20/204) (0.26 s)  ••—————————————————— 10%
  Running 1987.5 (30/204) (0.37 s)  •••————————————————— 15%
  Running 1990.0 (40/204) (0.49 s)  ••••———————————————— 20%
  Running 1992.5 (50/204) (0.61 s)  •••••——————————————— 25%
  Running 1995.0 (60/204) (0.73 s)  •••••——————————————— 30%
  Running 1997.5 (70/204) (0.85 s)  ••••••—————————————— 35%
  Running 2000.0 (80/204) (0.98 s)  •••••••————————————— 40%
  Running 2002.5 (90/204) (1.12 s)  ••••••••———————————— 45%
  Running 2005.0 (100/204) (1.26 s)  •••••••••——————————— 50%
  Running 2007.5 (110/204) (1.40 s)  ••••••••••—————————— 54%
  Running 2010.0 (120/204) (1.55 s)  •••••••••••————————— 59%
  Running 2012.5 (130/204) (1.71 s)  ••••••••••••———————— 64%
  Running 2015.0 (140/204) (1.87 s)  •••••••••••••——————— 69%
  Running 2017.5 (150/204) (2.03 s)  ••••••••••••••—————— 74%
  Running 2020.0 (160/204) (2.20 s)  •••••••••••••••————— 79%
  Running 2022.5 (170/204) (2.37 s)  ••••••••••••••••———— 84%
  Running 2025.0 (180/204) (2.56 s)  •••••••••••••••••——— 89%
  Running 2027.5 (190/204) (2.76 s)  ••••••••••••••••••—— 94%
  Running 2030.0 (200/204) (2.95 s)  •••••••••••••••••••— 99%
Simulation summary:
     738,665,102 total HPV infections
         531,465 total cancers
         311,473 total cancer deaths
            3.87 mean HPV prevalence (%)
           12.20 mean cancer incidence (per 100k)
           33.60 mean age of infection (years)
           43.65 mean age of cancer (years)
           58.83 mean age of cancer death (years)
[3]:
Sim(<no label>; 1980 to 2030; pop: 10000 default; epi: 7.38665e+08⚙, 531465♋︎)
This will generate a results dictionary sim.results. Results by genotype are named things like sim.results['infections'] and stored as arrays where each row corresponds to a genotype, while totals across all genotypes have names like sim.results['infections'] or sim.results['cancers'].
Rather than creating a parameter dictionary, any valid parameter can also be passed to the sim directly. For example, exactly equivalent to the above is:
[4]:
sim = hpv.Sim(n_agents=10e3, start=1980, end=2030)
sim.run()
Loading location-specific demographic data for "nigeria"
Initializing sim with 10000 agents
Loading location-specific data for "nigeria"
  Running 1980.0 ( 0/204) (0.02 s)  ———————————————————— 0%
  Running 1982.5 (10/204) (0.14 s)  •——————————————————— 5%
  Running 1985.0 (20/204) (0.26 s)  ••—————————————————— 10%
  Running 1987.5 (30/204) (0.38 s)  •••————————————————— 15%
  Running 1990.0 (40/204) (0.50 s)  ••••———————————————— 20%
  Running 1992.5 (50/204) (0.63 s)  •••••——————————————— 25%
  Running 1995.0 (60/204) (0.76 s)  •••••——————————————— 30%
  Running 1997.5 (70/204) (0.89 s)  ••••••—————————————— 35%
  Running 2000.0 (80/204) (1.02 s)  •••••••————————————— 40%
  Running 2002.5 (90/204) (1.16 s)  ••••••••———————————— 45%
  Running 2005.0 (100/204) (1.31 s)  •••••••••——————————— 50%
  Running 2007.5 (110/204) (1.45 s)  ••••••••••—————————— 54%
  Running 2010.0 (120/204) (1.61 s)  •••••••••••————————— 59%
  Running 2012.5 (130/204) (1.77 s)  ••••••••••••———————— 64%
  Running 2015.0 (140/204) (1.94 s)  •••••••••••••——————— 69%
  Running 2017.5 (150/204) (2.11 s)  ••••••••••••••—————— 74%
  Running 2020.0 (160/204) (2.29 s)  •••••••••••••••————— 79%
  Running 2022.5 (170/204) (2.47 s)  ••••••••••••••••———— 84%
  Running 2025.0 (180/204) (2.66 s)  •••••••••••••••••——— 89%
  Running 2027.5 (190/204) (2.86 s)  ••••••••••••••••••—— 94%
  Running 2030.0 (200/204) (3.06 s)  •••••••••••••••••••— 99%
Simulation summary:
     975,729,668 total HPV infections
         619,316 total cancers
         384,078 total cancer deaths
            4.72 mean HPV prevalence (%)
           14.87 mean cancer incidence (per 100k)
           33.27 mean age of infection (years)
           41.25 mean age of cancer (years)
           52.50 mean age of cancer death (years)
[4]:
Sim(<no label>; 1980 to 2030; pop: 10000 default; epi: 9.7573e+08⚙, 619316♋︎)
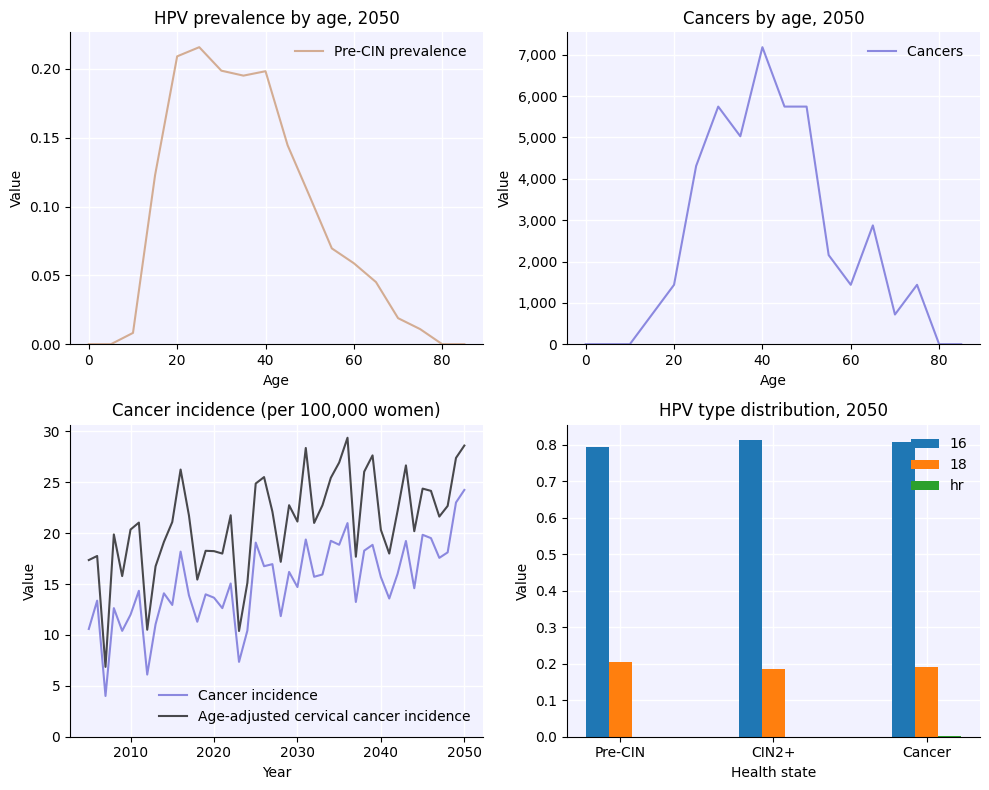
You can mix and match too – pass in a parameter dictionary with default options, and then include other parameters as keywords (including overrides; keyword arguments take precedence). For example:
[5]:
sim = hpv.Sim(pars, end=2050) # Use parameters defined above, except set the end data to 2050
sim.run()
Loading location-specific demographic data for "nigeria"
Initializing sim with 10000 agents
Loading location-specific data for "nigeria"
  Running 1980.0 ( 0/284) (0.02 s)  ———————————————————— 0%
  Running 1982.5 (10/284) (0.14 s)  ———————————————————— 4%
  Running 1985.0 (20/284) (0.26 s)  •——————————————————— 7%
  Running 1987.5 (30/284) (0.37 s)  ••—————————————————— 11%
  Running 1990.0 (40/284) (0.48 s)  ••—————————————————— 14%
  Running 1992.5 (50/284) (0.60 s)  •••————————————————— 18%
  Running 1995.0 (60/284) (0.72 s)  ••••———————————————— 21%
  Running 1997.5 (70/284) (0.85 s)  •••••——————————————— 25%
  Running 2000.0 (80/284) (0.98 s)  •••••——————————————— 29%
  Running 2002.5 (90/284) (1.11 s)  ••••••—————————————— 32%
  Running 2005.0 (100/284) (1.25 s)  •••••••————————————— 36%
  Running 2007.5 (110/284) (1.39 s)  •••••••————————————— 39%
  Running 2010.0 (120/284) (1.54 s)  ••••••••———————————— 43%
  Running 2012.5 (130/284) (1.70 s)  •••••••••——————————— 46%
  Running 2015.0 (140/284) (1.86 s)  •••••••••——————————— 50%
  Running 2017.5 (150/284) (2.02 s)  ••••••••••—————————— 53%
  Running 2020.0 (160/284) (2.19 s)  •••••••••••————————— 57%
  Running 2022.5 (170/284) (2.36 s)  ••••••••••••———————— 60%
  Running 2025.0 (180/284) (2.54 s)  ••••••••••••———————— 64%
  Running 2027.5 (190/284) (2.74 s)  •••••••••••••——————— 67%
  Running 2030.0 (200/284) (2.94 s)  ••••••••••••••—————— 71%
  Running 2032.5 (210/284) (3.13 s)  ••••••••••••••—————— 74%
  Running 2035.0 (220/284) (3.34 s)  •••••••••••••••————— 78%
  Running 2037.5 (230/284) (3.55 s)  ••••••••••••••••———— 81%
  Running 2040.0 (240/284) (3.77 s)  ••••••••••••••••———— 85%
  Running 2042.5 (250/284) (3.99 s)  •••••••••••••••••——— 88%
  Running 2045.0 (260/284) (4.23 s)  ••••••••••••••••••—— 92%
  Running 2047.5 (270/284) (4.47 s)  •••••••••••••••••••— 95%
  Running 2050.0 (280/284) (4.71 s)  •••••••••••••••••••— 99%
Simulation summary:
   1,294,788,720 total HPV infections
       1,098,506 total cancers
         712,976 total cancer deaths
            3.86 mean HPV prevalence (%)
           14.02 mean cancer incidence (per 100k)
           36.32 mean age of infection (years)
           45.05 mean age of cancer (years)
           51.69 mean age of cancer death (years)
[5]:
Sim(<no label>; 1980 to 2050; pop: 10000 default; epi: 1.29479e+09⚙, 1.09851e+06♋︎)
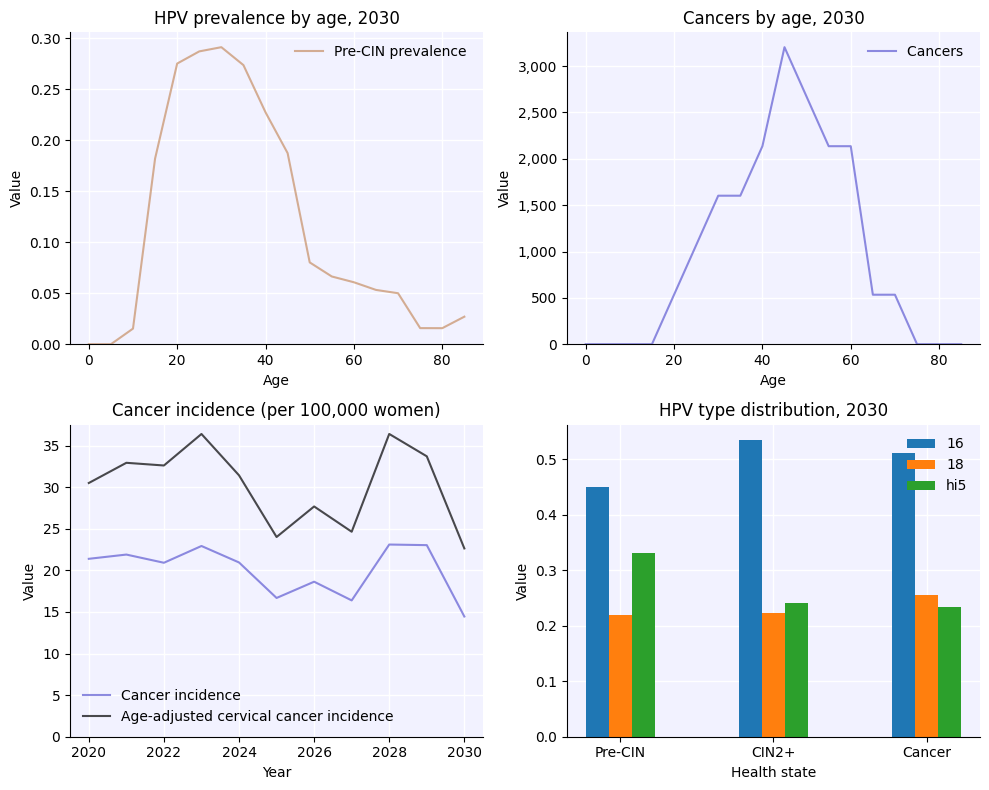
Plotting results#
As you saw above, plotting the results of a simulation is rather easy too:
[6]:
fig = sim.plot()
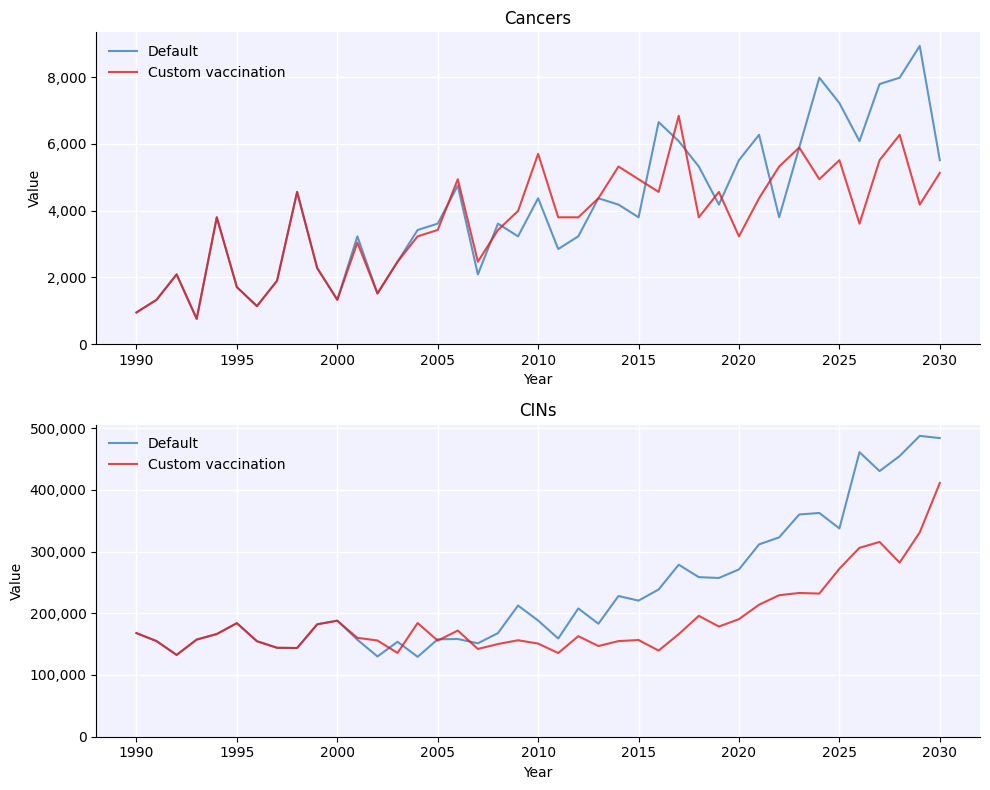
Full usage example#
Many of the details of this example will be explained in later tutorials, but to give you a taste, here’s an example of how you would run two simulations to determine the impact of a custom intervention aimed at protecting the elderly.
[7]:
import hpvsim as hpv

# Custom vaccination intervention
def custom_vx(sim):
    if sim.yearvec[sim.t] == 2000:
        target_group = (sim.people.age>9) * (sim.people.age<14)
        sim.people.peak_imm[0, target_group] = 1

pars = dict(
    location = 'tanzania', # Use population characteristics for Japan
    n_agents = 10e3, # Have 50,000 people total in the population
    start = 1980, # Start the simulation in 1980
    n_years = 50, # Run the simulation for 50 years
    burnin = 10, # Discard the first 20 years as burnin period
    verbose = 0, # Do not print any output
)

# Running with multisims -- see Tutorial 3
s1 = hpv.Sim(pars, label='Default')
s2 = hpv.Sim(pars, interventions=custom_vx, label='Custom vaccination')
msim = hpv.MultiSim([s1, s2])
msim.run()
fig = msim.plot(['cancers', 'cins'])
Loading location-specific demographic data for "tanzania"
Loading location-specific demographic data for "tanzania"
[ ]: