Components of a preprocessing script#
Here we will look at a generated preprocessing script and break it down into parts.
The following script is the default script created by survey for the built-in
demonstration data (zambia_data) that comes with Vis-Tools.
# Generated by Survey.py

# This script is meant to be run from within the target simulation directory.

import time as tm
from os import path, getcwd
from vis_tools import VisSet, SpatialBinary, SpatialReports

# Constants
k_name = path.basename(getcwd())
k_sim_dir = r'.'
k_sim_output_dir = r'.\output'
k_products_dir = path.join(k_sim_dir, path.relpath(path.dirname(path.abspath(__file__)), getcwd()))
k_demographics_path_or_list = r'.\Bbondo_filled_calib_29.842464_prop.json'
k_sim_url_root = '/' + path.basename(getcwd()) + '/'
k_spatial_report_dir = k_sim_output_dir
k_config_path = r'.\config.json'
k_event_recorder_path = r'.\output\ReportEventRecorder.csv'
k_human_migration_path = r'.\output\ReportHumanMigrationTracking.csv'
k_malaria_filtered_path = r'.\output\ReportMalariaFiltered.json'

# Appearance-related constants
k_icon_duration_days = 2

# ==============================================================================
# Main program
#
# This Vis-Tools preprocessing program contains various useful examples in the
# form of comments. Whenever possible the examples are made to be valid for the
# present simulation, but in some cases you may have to modify the examples to
# be valid in your context. Note that in this script you can override any option
# or default value you see in defaultvisset.json.
# ==============================================================================
if __name__ == '__main__':
    script_start = tm.time()

    # Create a default VisSet
    vis_set = VisSet(k_name)

    # Set up the VisSet
    vis_set.set_target_client('Geospatial')
    vis_set.set_products_directory(k_products_dir)
    vis_set.set_config(k_config_path)
    vis_set.set_demographics(k_demographics_path_or_list)
    vis_set.set_node_vis_type('Points')

    # Remove the 'elsewhere' node from the node stats. This doesn't remove the
    # node, just leaves it out of min/max stats. Do this before adding the
    # spatial binaries, so as to also exclude that node from the spatial stats.
    # vis_set.exclude_node_from_stats(1001)

    # Inset chart
    vis_set.set_inset_chart(k_malaria_filtered_path)
    # vis_set.options['insetCharts']['defaultChannelName'] =
    #     'Infectious Vectors'

    # Add extra NodeAttribute fields
    vis_set.add_node_field('InitialPopulation')
    # vis_set.add_node_field('BirthRate')

    # Create a SpatialReports object that scans the simulation output directory
    # looking for SpatialReport_*.bin files. Later we'll add this to the VisSet
    # object.
    reports = SpatialReports(k_spatial_report_dir)

    # Example of creating an infected vectors count spatial binary by combining
    # SpatialReport_Adult_Vectors with SpatialReport_Infectious_Vectors. Once
    # created, we manually add the new report to the reports object
    # def combine(a, b):
    #     return int(a * b)
    # print('Synthesizing Infectious Vectors Count spatial binary...')
    # infected_vectors_count = SpatialBinary.combine(
    #     path.join(k_spatial_report_dir, 'SpatialReport_Adult_Vectors.bin'),
    #     path.join(k_spatial_report_dir, 'SpatialReport_Infectious_Vectors.bin'),
    #     'Infectious Vectors Count',
    #     combine)
    # report_path = path.join(k_products_dir,
    #     'SpatialReport_Infectious_Vectors_Count.bin')
    # infected_vectors_count.write_binary(report_path)
    # reports.add(report_path)

    # Add spatial reports (also establishes timestep count)
    vis_set.add_spatial_reports(reports)

    # Include only a subset of available spatial reports. If you have a lot of
    # spatial reports, you may run out of memory on the client side. So here you
    # can easily decide which channels are important and include just those
    # channels. All available channels are shown below, so just delete the lines
    # for channels you don't care about.
    vis_set.include_spatial_channels([
        'SpatialReport_Adult_Vectors',
        'SpatialReport_Daily_Bites_Per_Human',
        'SpatialReport_Daily_EIR',
        'SpatialReport_Human_Infectious_Reservoir',
        'SpatialReport_Infectious_Vectors',
        'SpatialReport_Infectious_Vectors_Count',
        'SpatialReport_Mean_Parasitemia',
        'SpatialReport_New_Clinical_Cases',
        'SpatialReport_New_Diagnostic_Prevalence',
        'SpatialReport_New_Infections',
        'SpatialReport_Population',
        'SpatialReport_Prevalence'
    ])

    # Infected human migration (do this after adding spatial reports)
    vis_set.set_event_recorder(k_event_recorder_path)
    vis_set.add_infected_human_migrations(k_human_migration_path)

    # Add event marker layers
    # vis_set.add_marker_layer('Received_Treatment',
    #                          marker=VisSet.k_marker_shape_triangle,
    #                          color='green')
    # vis_set.add_marker_layer('NewInfectionEvent',
    #                          marker=VisSet.k_marker_shape_triangle,
    #                          color='blue')

    # Other option overrides
    # vis_set.options['defaultBaseLayer'] = 'ESRI National Geographic'
    vis_set.hide_layer('heatmapVis')

    # Example bindings (NOTE: You may or may not have these sources available.
    # You will have to modify these examples to utilize your available sources.)
    # vis_set.add_binding('nodeVis', 'pointSize',
    #                     'InitialPopulation', 'scale(3, 16)')
    # vis_set.add_binding('nodeVis', 'pointColor',
    #                     'SpatialReport_Prevalence', 'sampleGradient()')
    # vis_set.add_binding('heatmapVis', 'source',
    #                     'SpatialReport_Infectious_Vectors_Count', 'none()')

    # Consistency check
    vis_set.validate()

    # Emit VisSet
    vis_set.write_as('visset.json', k_sim_url_root)

    # Emit URL
    print('When using the standalone Vis-Tools server, use the following URL:')
    visset_path = path.join(k_products_dir, 'visset.json').replace('\\', '/')
    visset_path = visset_path.replace('./', k_sim_url_root)
    print('http://localhost:8000/vistools/geospatial.html?set=%s' % visset_path)

    # Done
    script_end = tm.time()
    print('\nElapsed time %.2f seconds' % float(script_end - script_start))
Imports and constants#
# Generated by Survey.py

# This script is meant to be run from within the target simulation directory.

import time as tm
from os import path, getcwd
from vis_tools import VisSet, SpatialBinary, SpatialReports

# Constants
k_name = path.basename(getcwd())
k_sim_dir = r'.'
k_sim_output_dir = r'.\output'
k_products_dir = path.join(k_sim_dir, path.relpath(path.dirname(path.abspath(__file__)), getcwd()))
k_demographics_path_or_list = r'.\Bbondo_filled_calib_29.842464_prop.json'
k_sim_url_root = '/' + path.basename(getcwd()) + '/'
k_spatial_report_dir = k_sim_output_dir
k_config_path = r'.\config.json'
k_event_recorder_path = r'.\output\ReportEventRecorder.csv'
k_human_migration_path = r'.\output\ReportHumanMigrationTracking.csv'
k_malaria_filtered_path = r'.\output\ReportMalariaFiltered.json'

# Appearance-related constants
k_icon_duration_days = 2
This section imports some built-in Python classes and a few of the Vis-Tools classes as well.
VisSetis a wrapper class for the output visset file. Most of the preprocessing script revolves around populating and making method calls on aVisSetobject.SpatialBinaryis a wrapper class for an EMOD spatial binary report, which generally ends with the file extension .bin. (The file format for those files is documented in Spatial output report.SpatialReportsis a collection class that surveys and manages the list of spatial reports found (typically) in a simulation’s output directory.
Next the script defines some constants with file paths.
Finally, k_icon_duration_days controls how long marker
icons show up in marker layers. This is described in more detail in
Marker layers below.
Setup of the VisSet object#
# ==============================================================================
# Main program
#
# This Vis-Tools preprocessing program contains various useful examples in the
# form of comments. Whenever possible the examples are made to be valid for the
# present simulation, but in some cases you may have to modify the examples to
# be valid in your context. Note that in this script you can override any option
# or default value you see in defaultvisset.json.
# ==============================================================================
if __name__ == '__main__':
    script_start = tm.time()

    # Create a default VisSet
    vis_set = VisSet(k_name)

    # Set up the VisSet
    vis_set.set_target_client('Geospatial')
    vis_set.set_products_directory(k_products_dir)
    vis_set.set_config(k_config_path)
    vis_set.set_demographics(k_demographics_path_or_list)
    vis_set.set_node_vis_type('Points')
This section begins the main program. First it creates a VisSet object. This
object, at the end of the program, is emitted as a visset.json file.
Next the VisSet object is populated with some basic information.
set_targetindicates which visualization client theVisSetis targeting. Currently there is only one visualization target:Geospatial. Subsequent versions of Vis-Tools will have additional visualization clients.set_products_directorytells theVisSetthe directory to which to write its products (e.g. the visset.json file, animation layer files, etc.) The products directory helps keep preprocessing outputs from polluting your simulation directory, and helps isolate them from other users who might also visualize your simulation with Vis-Tools.set_configtells theVisSetthe path to the simulation configuration JSON file, which is typically named config.json.set_demographicstells theVisSetthe file path to the simulation’s demographics file (or an array of filenames, if so specified in the config.json file). TheVisSetwill open and digest the node data here as well.set_node_vis_typetells theVisSetwhat node representation to use: two-dimensional points or three-dimensional shapes, as described in Points versus shapes.
Drop a node from statistics#
# Remove the 'elsewhere' node from the node stats. This doesn't remove the
# node, just leaves it out of min/max stats. Do this before adding the
# spatial binaries, so as to also exclude that node from the spatial stats.
# vis_set.exclude_node_from_stats(1001)
This code, which is commented out by default, shows how to drop a node from the
min/max statistics. This is specifically for handling simulations that use an
“elsewhere” node in migrations, as mentioned in the comments, to keep such a
node from skewing population and other ranges. Multiple nodes can also be
excluded with vis_set.exclude_nodes_from_stats.
Inset chart#
# Inset chart
vis_set.set_inset_chart(k_malaria_filtered_path)
# vis_set.options['insetCharts']['defaultChannelName'] =
#     'Infectious Vectors'
This section associates an inset chart file with the VisSet. The inset charts file typically contains aggregated information about the simulation. When an inset chart file is attached, the visualization will have an inset chart panel, which looks like this:
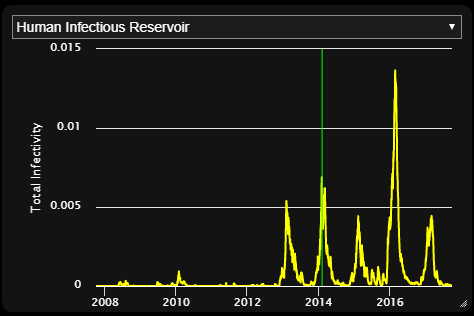
The inset panel will include all the channels in the associated inset chart file.
It is common for EMOD simulations to emit a file called InsetChart.json,
but for Vis-Tools, any file with the same format as an inset chart file will work.
For example, some malaria simulations emit a ReportMalariaFiltered.json
file, which has the same format as InsetChart.json. In our example
preprocessing script, survey did not find an InsetChart.json file, but
did find ReportMalariaFiltered.json, so it included that as the inset file.
To learn more about the format of inset chart files, see Inset chart output report.
Extra node attributes#
# Add extra NodeAttribute fields
vis_set.add_node_field('InitialPopulation')
# vis_set.add_node_field('BirthRate')
This bit of code lets us take elements of the demographics file’s NodeAttributes
and copy them into the VisSet abbreviated node data. By default Vis-Tools keeps
only the following information about nodes:
Latitude
Longitude
Altitude (if present)
You can call the VisSet add_node_field method to take additional fields from
the NodeAttribute section of the node’s demographic data. For example, to also
retain the BirthRate NodeAttribute, you would add:
vis_set.add_node_field('BirthRate')
Retained NodeAttribute fields aren’t limited to numeric fields. You can include text fields too, such as names, catchment areas, or regional identifiers that you may have added to your demographics file.
Creation of a new spatial binary#
# Create a SpatialReports object that scans the simulation output directory
# looking for SpatialReport_*.bin files. Later we'll add this to the VisSet
# object.
reports = SpatialReports(k_spatial_report_dir)

# Example of creating an infected vectors count spatial binary by combining
# SpatialReport_Adult_Vectors with SpatialReport_Infectious_Vectors. Once
# created, we manually add the new report to the reports object
# def combine(a, b):
#     return int(a * b)
# print('Synthesizing Infectious Vectors Count spatial binary...')
# infected_vectors_count = SpatialBinary.combine(
#     path.join(k_spatial_report_dir, 'SpatialReport_Adult_Vectors.bin'),
#     path.join(k_spatial_report_dir, 'SpatialReport_Infectious_Vectors.bin'),
#     'Infectious Vectors Count',
#     combine)
# report_path = path.join(k_products_dir,
#     'SpatialReport_Infectious_Vectors_Count.bin')
# infected_vectors_count.write_binary(report_path)
# reports.add(report_path)
First Vis-Tools creates a reports variable that contains a collection of spatial reports (SpatialReport_*.bin) found in the simulation’s output directory. This list is established so that we can, if so desired, create additional reports to add to the collection.
Vis-Tools is not just a visualization technology; it is also a toolset. This next section of code (which is commented out) shows how you can use Vis-Tools to create a new spatial report by combining two existing reports. This example multiplies Adult Vectors by Infections Vectors to obtain Infectious Vector Count, then writes that data to a new spatial report binary file.
Note
The simulation’s spatial reports reside in the simulation’s output
directory. New spatial reports created using combine are instead put
in the products directory, to avoid polluting the simulation’s original
data.
Inclusion of spatial reports#
# Add spatial reports (also establishes timestep count)
vis_set.add_spatial_reports(reports)

# Include only a subset of available spatial reports. If you have a lot of
# spatial reports, you may run out of memory on the client side. So here you
# can easily decide which channels are important and include just those
# channels. All available channels are shown below, so just delete the lines
# for channels you don't care about.
vis_set.include_spatial_channels([
    'SpatialReport_Adult_Vectors',
    'SpatialReport_Daily_Bites_Per_Human',
    'SpatialReport_Daily_EIR',
    'SpatialReport_Human_Infectious_Reservoir',
    'SpatialReport_Infectious_Vectors',
    'SpatialReport_Infectious_Vectors_Count',
    'SpatialReport_Mean_Parasitemia',
    'SpatialReport_New_Clinical_Cases',
    'SpatialReport_New_Diagnostic_Prevalence',
    'SpatialReport_New_Infections',
    'SpatialReport_Population',
    'SpatialReport_Prevalence'
])
This section starts by calling the VisSet add_spatial_reports method to add
the spatial reports (including any you may have synthesized) to the VisSet.
The VisSet include_spatial_channels call has a list of spatial channels that
were present when survey was run. This call is here to allow you to remove
some channels that you don’t need, in case you run out of memory in the
Geospatial client. You can simply comment out any reports to which you
don’t need access.
Infected human migration#
# Infected human migration (do this after adding spatial reports)
vis_set.set_event_recorder(k_event_recorder_path)
vis_set.add_infected_human_migrations(k_human_migration_path)
This section creates an Infected Human Migrations animation layer for the
visualization. To create that animation, the VisSet needs both the
ReportEventRecorder.csv and the ReportHumanMigrationTracking.csv report.
It combines the information in those two sources to find migrations of only
infected individuals and adds them to the animation layer.
Note
The Infected Human Migrations animation layer is written to a file called InfectedMigrations.czml in the products directory.
Note
If your simulation lacks either an ReportEventRecorder.csv or a
ReportHumanMigrationTracking.csv file, survey won’t emit any code for
preprocessing the Infected Human Migrations animation.
Marker layers#
# Add event marker layers
# vis_set.add_marker_layer('Received_Treatment',
#                          marker=VisSet.k_marker_shape_triangle,
#                          color='green')
# vis_set.add_marker_layer('NewInfectionEvent',
#                          marker=VisSet.k_marker_shape_triangle,
#                          color='blue')
A marker layer is a type of animation that creates markers near nodes when
particular events occur in the ReportEventRecorder.csv.
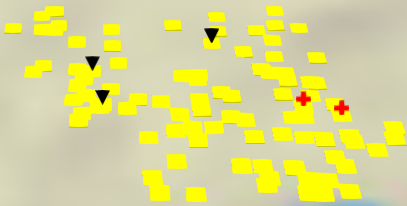
To add a marker layer, you call the VisSet add_marker_layer method,
passing the name of the event, as well as the marker shape and color. For more
information about adding marker layers, see vis_tools.VisSet.
Note
Marker layers are generated as new .czml files that are written to the
products directory.
Options and bindings#
# Other option overrides
# vis_set.options['defaultBaseLayer'] = 'ESRI National Geographic'
vis_set.hide_layer('heatmapVis')

# Example bindings (NOTE: You may or may not have these sources available.
# You will have to modify these examples to utilize your available sources.)
# vis_set.add_binding('nodeVis', 'pointSize',
#                     'InitialPopulation', 'scale(3, 16)')
# vis_set.add_binding('nodeVis', 'pointColor',
#                     'SpatialReport_Prevalence', 'sampleGradient()')
# vis_set.add_binding('heatmapVis', 'source',
#                     'SpatialReport_Infectious_Vectors_Count', 'none()')
This section starts by calling the VisSet hide_layer method to make it so
that when the visset is loaded by the Vis-Tools Geospatial client, the heatmap layer
will be turned off (unchecked) by default.
This is an example of a customization you can make on the preprocessing side that sets the initial state of the visset when it is loaded into the client.
The code below that shows examples of adding bindings between visual parameters and simulation data channels. For more on bindings, see Geospatial.
Note
There are many options and styles you can override in your preprocessing script. To see the defaults, and what options and styles are available, look at the defaultvisset.json file in the Vis-Tools directory.
For example, here is a small section of defaultvisset.json:
"defaultOptions": {
  "Geospatial": {
    "defaultAltitudeM": 1,
    "defaultBaseLayer": "Bing Maps Aerial",
    "clockStepDurationSecs": 14400,
    "clockInitialTimestep": 0,
    "clockAutoRun": false,
If you wanted to change the base map used in your visualization to a road-style map instead of a satellite map, you could add the following line to your preprocessing script:
visset.options["defaultBaseLayer"] = "OpenStreetMap"
Finish preprocessing#
# Consistency check
vis_set.validate()

# Emit VisSet
vis_set.write_as('visset.json', k_sim_url_root)

# Emit URL
print('When using the standalone Vis-Tools server, use the following URL:')
visset_path = path.join(k_products_dir, 'visset.json').replace('\\', '/')
visset_path = visset_path.replace('./', k_sim_url_root)
print('http://localhost:8000/vistools/geospatial.html?set=%s' % visset_path)

# Done
script_end = tm.time()
print('\nElapsed time %.2f seconds' % float(script_end - script_start))
The last part of the preprocessing script calls the VisSet validate method
to check it for consistency, then writes the visset file to the products directory.
Note
You can have as many visset files as you want for a given simulation. It may make sense to do that if you have different aspects of your simulation that you wish to demonstrate, each requiring a specific visual presentation.
To do this, make copies of your preprocessing script with the various
customizations you want, and modify each scripts’ write_as call to use
a different file name. After you run all of them, you’ll have multiple
visset files in your products directory, which you can point to using the
URL parameter set= as shown above.