Preprocessing cycle#
It may be useful to think of using Vis-Tools as a cycle.
Run
surveyon your simulation data to generate a preprocessing script.Run the preprocessing script (which will be in the Vis-Tools folder) to generate a visset file.
Browse to the URL printed by the preprocessing script (http://localhost:8000/…) and evaluate the visualization.
Modify the preprocessing script to suit your liking, then go back to step 2.
This page is mostly concerned with generating, running, and modifying the preprocessing script. The visualization step is covered in detail in Geospatial.
Create a default preprocessing script#
While it is possible to write a preprocessing script from scratch using the
Python classes provided in Vis-Tools, typically you will let the survey program
generate a default preprocessing script for you, and then customize that script
to your liking.
survey looks at the available data in your simulation folder and emits a
preprocessing script for you, which varies depending on what data your
simulation contains. For example, if your simulation contains both files
ReportHumanMigrationTracking.csv and ReportEventRecorder.csv, survey
will emit code that creates an animation layer for infected human migration.
Here is the command-line usage for the survey program:
usage:

To create a preprocessing script for a simulation:
survey -i <sim_dir> -o <out_py_file> -t <Points|Shapes>

To update an existing visset.json with Asset Manager URLS:
survey -i <visset_path> -a <asset_map_path>

Survey generates Vis-Tools preprocessing scripts or updates existing
visset.json files with COMPS Asset Manager URLs.

optional arguments:
  -h, --help            show this help message and exit
  -a ASSET_MAP_PATH, --assetmap ASSET_MAP_PATH
                        Path to a VtAssetMap.json file.
  -d DEMOGRAPHICS_PATH, --demographics DEMOGRAPHICS_PATH
                        Full path to demographics file.
  -f, --force           Write new preprocessing script even if one already
                        exists with the same MD5.
  -i SIM_DIR, --input SIM_DIR
                        Directory containing simulation input and output
                        files, or to a visset.json for update.
  -o OUT_FILE, --output OUT_FILE
                        Output script path.
  -p PRODUCTS_DIR, --products PRODUCTS_DIR
                        Directory to be used for preprocessing output
                        products. If not specified, <sim_dir>/output/ will be
                        used.
  -s SIM_ID, --simid SIM_ID
                        Simulation ID.
  -t {Points,Shapes}, --type {Points,Shapes}
                        Value indicating node representation type.
  -v, --verbose         Emit extra messages for debugging and timing.
  -vv, --verbose-debug  Extra debug output.
The preprocessing scripts generated by survey are well-commented and contain
sections of commented-out code that show best practices for various
visualization scenarios, such as adding marker layers. Such best practices are
described in Components of a preprocessing script.
Note
For SIM_DIR and OUT_FILE arguments, use forward slashes (/) in any paths you specify there, e.g.:
survey -i my_sim/run_1 -t Points
Note
The output of survey is a new Python program. So if you use the -o switch
the OUT_FILE should have a “.py” extension, e.g.:
survey -i my_sim -t Points -o my_sim_prep.py
Important
The survey program is meant to be run from within a simulation directory. For
example, a typical usage might be:
cd my\sim\sir
survey -t Shapes
Run survey on your own simulation data#
Follow the steps below to run the survey program on your own
simulation’s data.
Note
The only files strictly required for visualization are a demographics file with latitude and longitude locations for your nodes and either a) a configuration file or b) at least one spatial report output/SpatialBinary_xxx.bin. Either of those latter two files provide the simulation timestep duration. Climate files are not needed by Vis-Tools.
Copy your simulation’s input and output data, including a demographics file and the output directory, into a new directory inside the Vis-Tools directory. This is required because Vis-Tools has its own local web server, which serves up only the Vis-Tools directory, and your simulation’s data needs to be among that.
For this example, we assume the data is copied to a directory called my_sim within the Vis-Tools directory.
Open a command prompt window and
cdto the simulation’s directory within the Vis-Tools directory, then runsurvey:cd my_sim survey -t Points
surveywill emit a preprocessing Python script within the simulation directory called (by default) preprocess_sim.py. Because the-t Pointsargument was specified on the command line, that preprocessing script will represent your simulation’s nodes as two-dimensional points when run. For more on the difference between points and shapes, see Points versus shapes.(Optional) Open and modify the preprocessing script to customize it to meet your needs.
Run the preprocessing script#
Now that you created a default preprocessing script with survey, you can
edit it to suit your needs or just run it as-is. Continuing with the “my_sim”
example above, to run the preprocessing script, use the command:
python Vis-Tools\...\preprocess_sim.py
(Where “…” above denotes the MD5 hash directory.) Running the script will generate a visset at my_sim/Vis-Tools/…/visset.json. The output of the preprocessing script shows the URL you will use to visualize the simulation. In this example that will be:
http://localhost:8000/geospatial.html?set=/my_sim/Vis-Tools/.../visset.json
(Where again “…” above denotes the MD5 hash directory.) Make note of the URL from your simulation preprocessing output and continue to the next section.
Visualize the simulation#
Ensure the local http server is running. See Start the web server.
In a browser, paste in the URL emitted by your preprocessing script.
Once the Vis-Tools Geospatial client page loads, you will see the yellow dots of your simulation’s nodes. For complete details on customizing the Geospatial client, see Geospatial.
Points versus shapes#
The Vis-Tools Geospatial client can represent the nodes of your simulation as either:
Points, which are two-dimensional circles measured in pixels, or
Shapes, which are three-dimensional rectangles measured in meters.
Those two representations have different visual parameters that you can bind to the outputs of your simulation. Depending on what you want to show, and how many simulation data channels you need to represent simultaneously, one of those may benefit you more than the other.
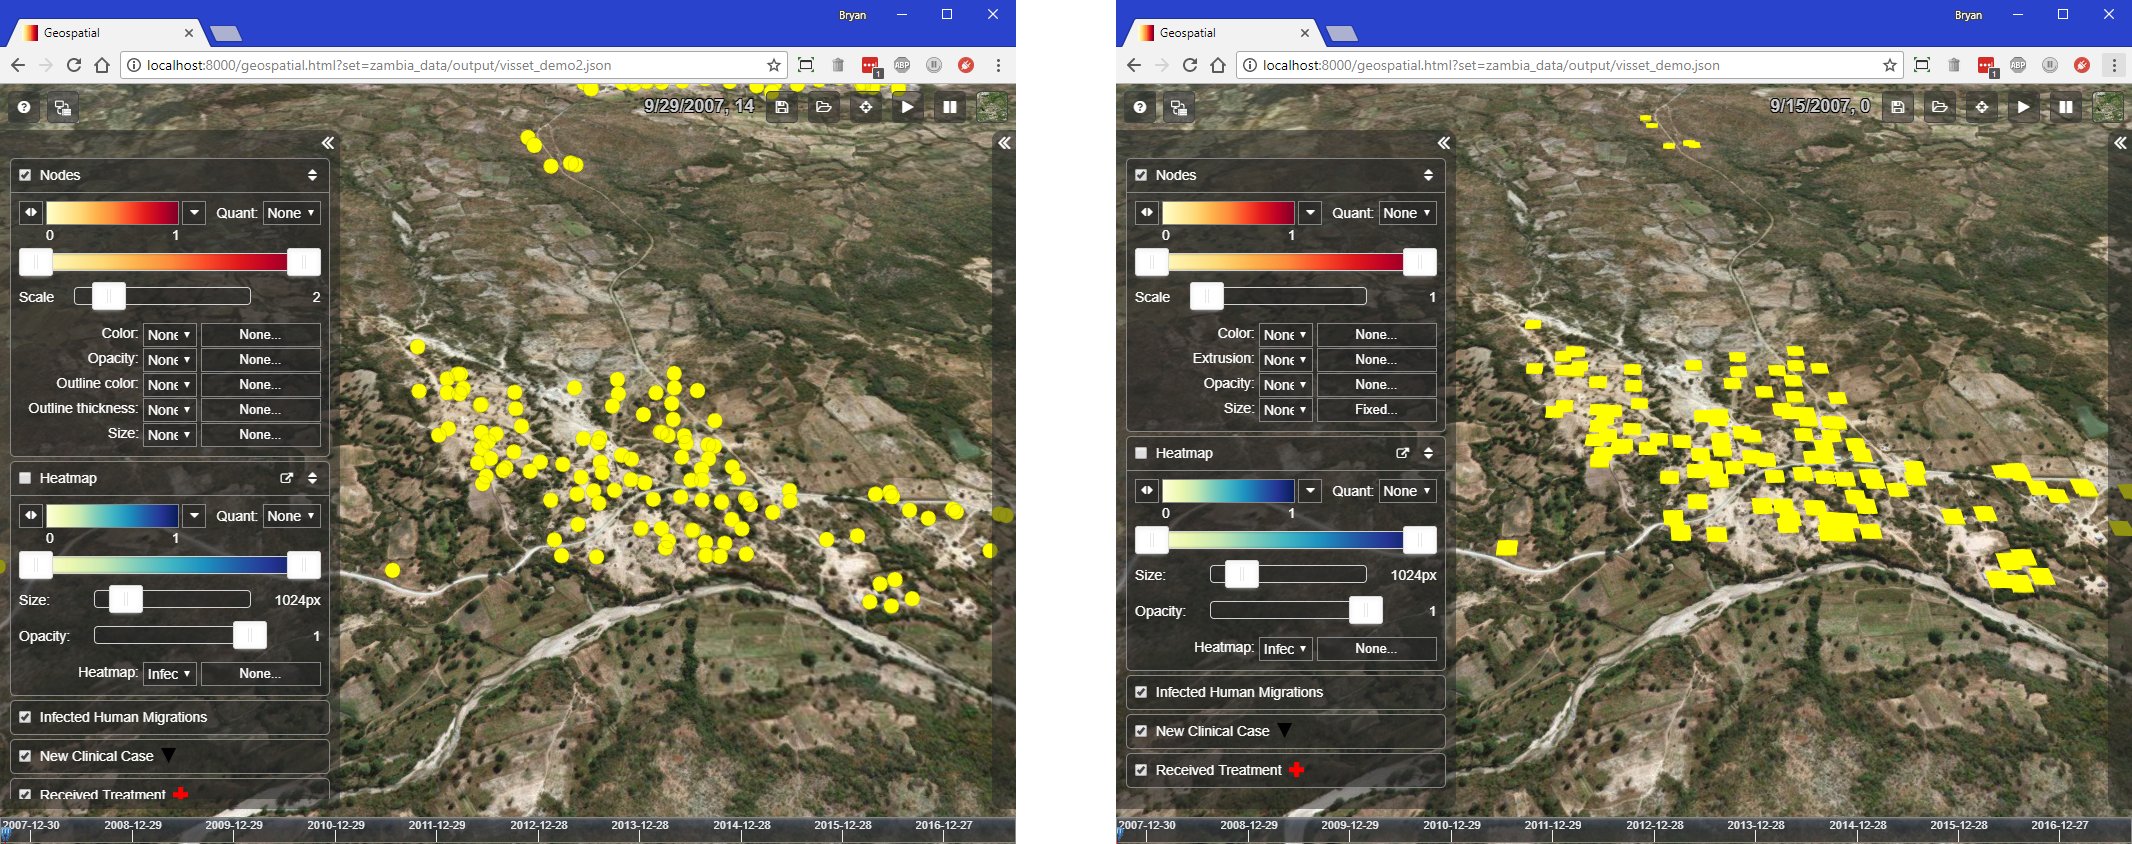
Point nodes (left) and shape nodes (right)#
When you run survey, you can indicate which representation you want. If you
don’t specify a -t argument to the survey program, it will by default
create a preprocessing script using a points representation for nodes. However, it is
not difficult to change the script to use shapes instead if you change your mind.
For more information on the points and shapes representation of nodes, see Geospatial.