Running Vis-Tools Standalone#
This page walks you through the the steps to download and install Vis-Tools, start the local web server that serves the visualizations, and trying out a sample visualization included with the installation.
Download#
Download the Vis-Tools archive from Vis-Tools Distribution on GitHub.
Unzip#
The first part of Vis-Tools installation a matter of unzipping this distribution ZIP file to a convenient location, such as your computer’s desktop.
Right-click the Vis-Tools zip file.
Select Extract All from the context menu.
In the Extract Compressed (Zipped) Folders dialog box, use the Browse button to browse to the desired location on your computer’s local hard drive.
Click Extract.
Note
Vis-Tools will not work if installed to a network UNC path (that is, a path starting with “\\”.
Note
It is highly recommended that you install Vis-Tools to a local drive location. Vis-Tools will work when installed on a mapped network drive, but performance will be impacted.
Install vis_tools Python package#
Vis-Tools preprocessing is taken care of by classes in the included vis_tools
Python package.
Choose Start > Command Prompt to get a cmd.exe command prompt window
Change directory to the location where you unzipped the Vis-Tools distribution zip file.
Run the command:
python setup.py install
That command will install the prerequisite packages and the
vis_toolspackage itself.Verify installation of the package by running the command:
survey --help
Which will show the options for the built-in
surveyprogram, which makes default preprocessing scripts for you.
Prepare the Geospatial client#
The Vis-Tools client uses several third-party libraries that are not included with the distribution.
Choose Start > Command Prompt to get a cmd.exe command prompt window
Change directory to the location where you unzipped the Vis-Tools distribution zip file.
Run the commands:
cd vistools
npm install
That command will install the third-party Javascript libraries into a
node_modulesfolder.
Start the web server#
Because Vis-Tools visualizations run in a web browser, standalone Vis-Tools is served from a small local web server that runs on your computer. It only serves up the files within the Vis-Tools folder. In this section we will start that web server.
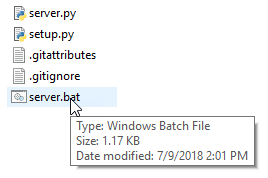
Open the folder in which you extracted the Vis-Tools archive in the previous step.
Double-click the file server.bat.
You will see a console window open that looks like this:
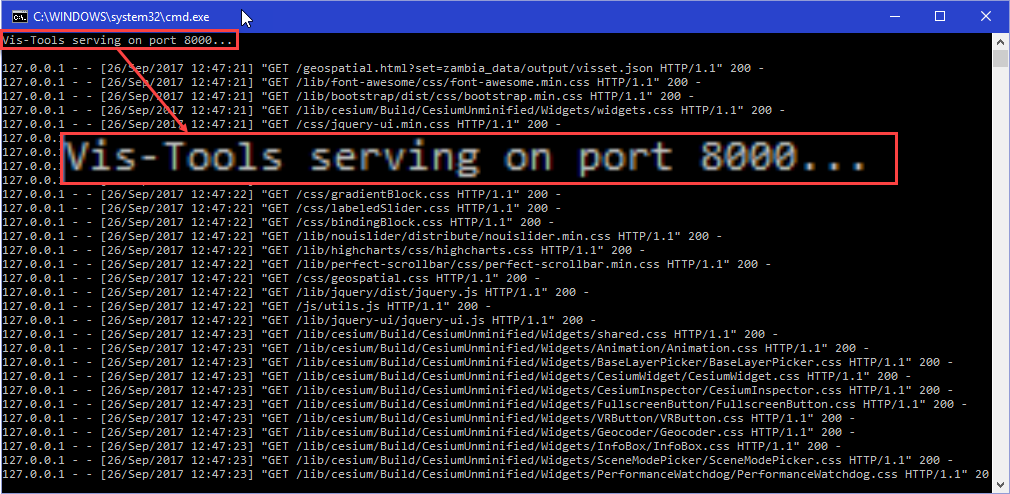
If you get an error starting the web server, check Troubleshooting.
Normally you will want to leave this command window open. To get it out of the way, you can click the minimize button its title bar. To stop the web server at any time, simply close the window with the × button in its title bar.
Try the web client#
In the previous step, you started a local web server that serves the files within the Vis-Tools folder to a web browser. That step, if successful, also opens a web browser window to the URL http://localhost:8000/vistools/geospatial.html?set=/zambia_data/Vis-Tools/shapes_demo/visset.json.
If that works, you should see a window that looks like this:
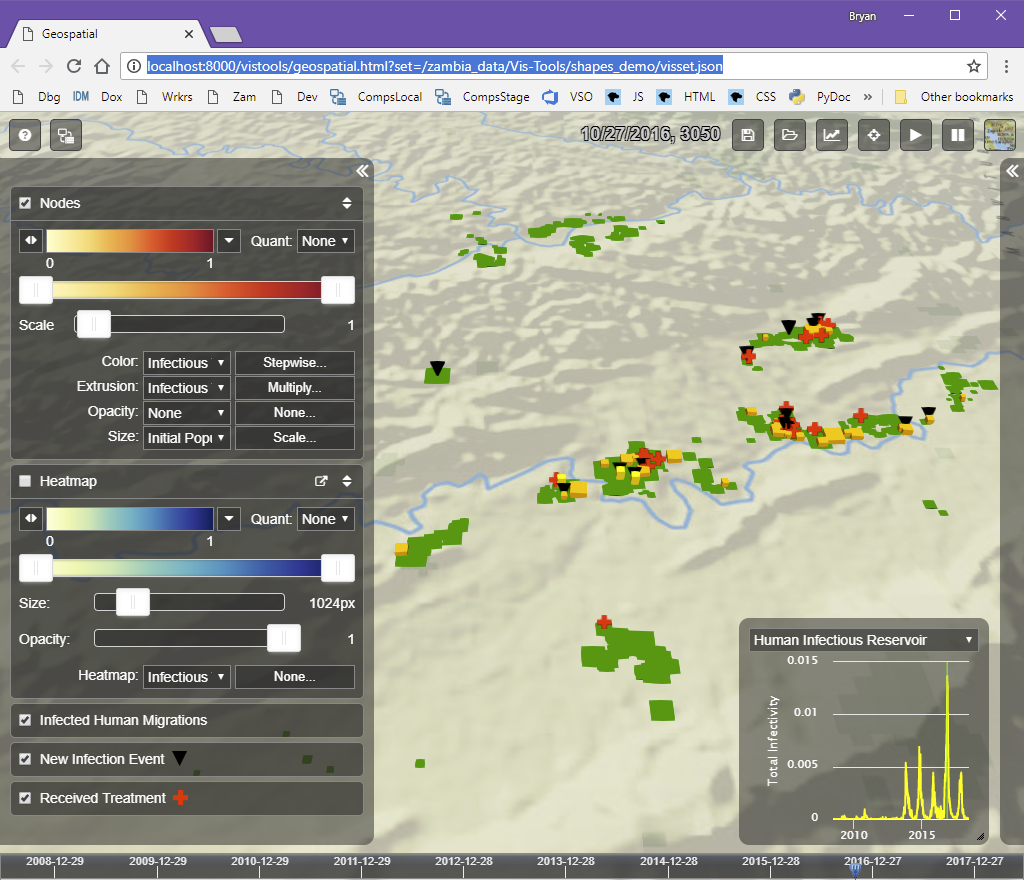
Here’s a quick overview of the parts of the Geospatial visualization window:
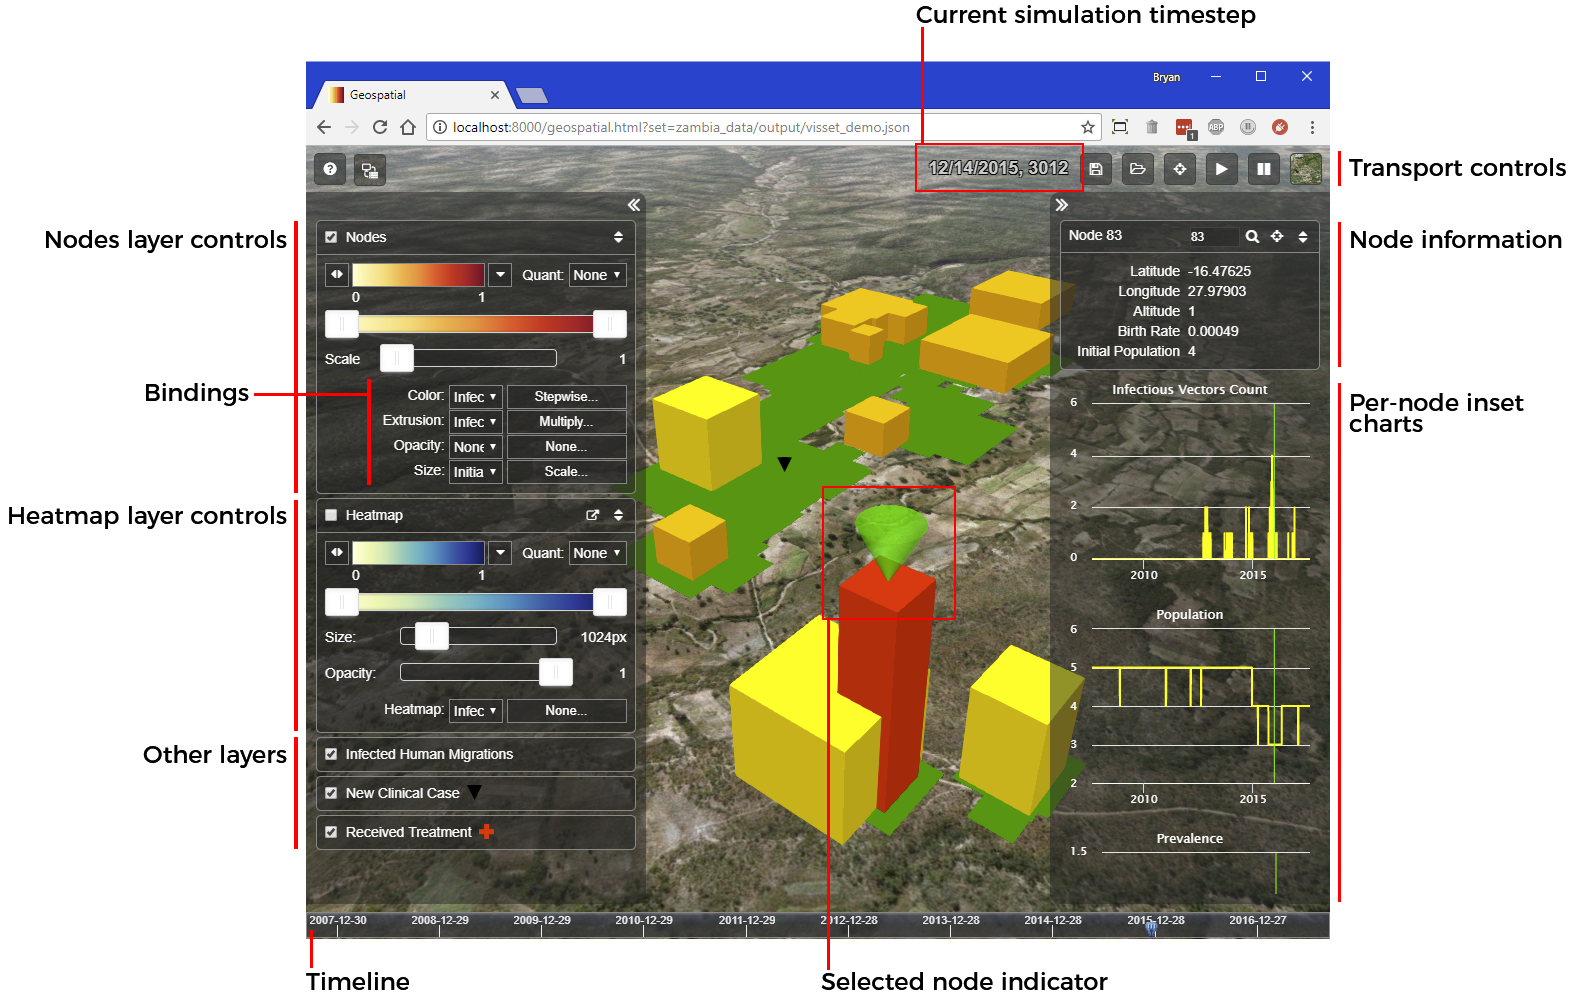
To introduce you to the client’s capabilities, try the following in the Geospatial visualization client.
Try dragging the blue time indicator around in the timeline at the bottom of the screen. This simulation has some interesting activity near the end, around timestep 3000.
Try navigating the view in 3D.
Click-drag in the map will pan along the surface.
Ctrl-drag in the map will change the view angle.
Mouse wheel zooms in or out.
Try playing animation by clicking the Play button in the Transport area at the top of the window.
Try turning layers on and off with the layer checkboxes in the left panel.
Try changing bindings between available simulation data and visual parameters.
For detailed information about how the Geospatial client works, see Geospatial.