Visualize a demo simulation#
Note
This section describes the visualization of a demonstration simulation that is part of the standalone Vis-Tools distribution. If you haven’t already installed Vis-Tools standalone, see Running Vis-Tools Standalone
For a simulation to be visualized with Vis-Tools, a preprocessing step needs to be run that creates a visset file that drives the visualization. This section will show you the process of going from bare simulation data to a visualization using the built-in demo data that comes with the Vis-Tools standalone distribution.
Obtain your simulation data#
The first step is to obtain the simulation’s data, both input and output. The following are typically required:
The configuration file (config.json) for simulation duration, demographics file name, etc.
A demographics file (demographics.json) for node latitude and longitude locations, etc.
The whole output directory for spatial and other reports
(If these files and directories are not familiar, see Introduction to the software for more information.)
For this example, we’re going to use the demo data that is already present in the Vis-Tools distribution folder. To see what’s inside, double-click the zambia_data directory.
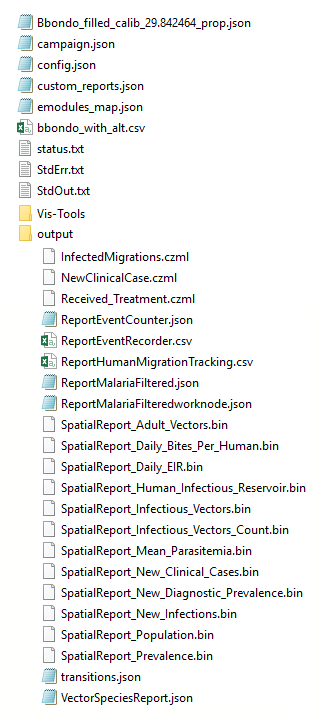
You can see it contains both input files such as config.json and campaign.json in addition to an output directory that contains a number of binary and CSV reports generated during the simulation run. Many of these files will be referenced in the following step.
Note
Some demographics files have “.compiled.json” at the end their names. Such files use a dictionary to reduce the overall size of the demographics file. Vis-Tools can consume both compiled and non-compiled demographics files.
Run Survey#
The Vis-Tools package contains a Python program called survey that can create a
default preprocessing script for you. In this step we’ll run that program and
take a look at the preprocessing script it created.
Open a command prompt window within the Vis-Tools directory. The easiest way to do this is to Shift-right-click an empty space in the Vis-Tools directory window and select Open command window here from the context menu.
The
surveyprogram needs to be run from within a simulation’s directory, so first let’s enter the zambia_data directory with this command:cd zambia_data
Now run
survey:survey
You will see some output like this:
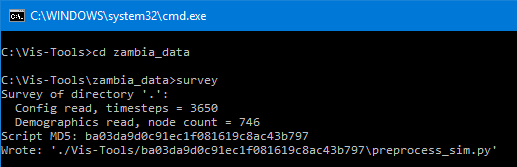
For our example, we can see survey has determined that our sim has 3,650
timesteps and 746 nodes, and has written a preprocessing script for us called
preprocess_sim.py.
Note
The preprocessing script has been written into the oddly-named directory
Vis-Tools/6bac0b833ebec278e86790150241b834. Vis-Tools concentrates all
of its outputs in a Vis-Tools directory to avoid unnecessarily polluting the
simulation directory. The long hexadecimal directory is actually the MD5
hash of the preprocess_sim.py script. This helps Vis-Tools keep
different runs of survey (with potentially different command-line
options) from overwriting each other.
Before we run it, let’s take a look at the default preprocessing script.
survey has created a script based on the available data in this simulation.
It contains sections that are commented out to suggest possible additions or
changes to customize the script to your particular needs:
# Generated by Survey.py

# This script is meant to be run from within the target simulation directory.

import time as tm
from os import path, getcwd
from vis_tools import VisSet, SpatialBinary, SpatialReports

# Constants
k_name = path.basename(getcwd())
k_sim_dir = r'.'
k_sim_output_dir = r'.\output'
k_products_dir = path.join(k_sim_dir, path.relpath(path.dirname(path.abspath(__file__)), getcwd()))
k_demographics_path_or_list = r'.\Bbondo_filled_calib_29.842464_prop.json'
k_sim_url_root = '/' + path.basename(getcwd()) + '/'
k_spatial_report_dir = k_sim_output_dir
k_config_path = r'.\config.json'
k_event_recorder_path = r'.\output\ReportEventRecorder.csv'
k_human_migration_path = r'.\output\ReportHumanMigrationTracking.csv'
k_malaria_filtered_path = r'.\output\ReportMalariaFiltered.json'

# Appearance-related constants
k_icon_duration_days = 2

# ==============================================================================
# Main program
#
# This Vis-Tools preprocessing program contains various useful examples in the
# form of comments. Whenever possible the examples are made to be valid for the
# present simulation, but in some cases you may have to modify the examples to
# be valid in your context. Note that in this script you can override any option
# or default value you see in defaultvisset.json.
# ==============================================================================
if __name__ == '__main__':
    script_start = tm.time()

    # Create a default VisSet
    vis_set = VisSet(k_name)

    # Set up the VisSet
    vis_set.set_target_client('Geospatial')
    vis_set.set_products_directory(k_products_dir)
    vis_set.set_config(k_config_path)
    vis_set.set_demographics(k_demographics_path_or_list)
    vis_set.set_node_vis_type('Points')

    # Remove the 'elsewhere' node from the node stats. This doesn't remove the
    # node, just leaves it out of min/max stats. Do this before adding the
    # spatial binaries, so as to also exclude that node from the spatial stats.
    # vis_set.exclude_node_from_stats(1001)

    # Inset chart
    vis_set.set_inset_chart(k_malaria_filtered_path)
    # vis_set.options['insetCharts']['defaultChannelName'] =
    #     'Infectious Vectors'

    # Add extra NodeAttribute fields
    vis_set.add_node_field('InitialPopulation')
    # vis_set.add_node_field('BirthRate')

    # Create a SpatialReports object that scans the simulation output directory
    # looking for SpatialReport*_*.bin files. Later we'll add this to the VisSet
    # object.
    reports = SpatialReports(k_spatial_report_dir)

    # Example of creating an infected vectors count spatial binary by combining
    # SpatialReport_Adult_Vectors with SpatialReport_Infectious_Vectors. Once
    # created, we manually add the new report to the reports object
    # def combine(a, b):
    #     return int(a * b)
    # print('Synthesizing Infectious Vectors Count spatial binary...')
    # infected_vectors_count = SpatialBinary.combine(
    #     path.join(k_spatial_report_dir, 'SpatialReport_Adult_Vectors.bin'),
    #     path.join(k_spatial_report_dir, 'SpatialReport_Infectious_Vectors.bin'),
    #     'Infectious Vectors Count',
    #     combine)
    # report_path = path.join(k_products_dir,
    #     'SpatialReport_Infectious_Vectors_Count.bin')
    # infected_vectors_count.write_binary(report_path)
    # reports.add(report_path)

    # Add spatial reports (also establishes timestep count)
    vis_set.add_spatial_reports(reports)

    # Include only a subset of available spatial reports. If you have a lot of
    # spatial reports, you may run out of memory on the client side. So here you
    # can easily decide which channels are important and include just those
    # channels. All available channels are shown below, so just delete the lines
    # for channels you don't care about.
    vis_set.include_spatial_channels([
        'SpatialReport_Adult_Vectors',
        'SpatialReport_Daily_Bites_Per_Human',
        'SpatialReport_Daily_EIR',
        'SpatialReport_Human_Infectious_Reservoir',
        'SpatialReport_Infectious_Vectors',
        'SpatialReport_Mean_Parasitemia',
        'SpatialReport_New_Clinical_Cases',
        'SpatialReport_New_Diagnostic_Prevalence',
        'SpatialReport_New_Infections',
        'SpatialReport_Population',
        'SpatialReport_Prevalence'
    ])

    # Infected human migration (do this after adding spatial reports)
    vis_set.set_event_recorder(k_event_recorder_path)
    vis_set.add_infected_human_migrations(k_human_migration_path)

    # Add event marker layers
    # vis_set.add_marker_layer('Received_Treatment',
    #                          marker=VisSet.k_marker_shape_triangle,
    #                          color='green')
    # vis_set.add_marker_layer('NewInfectionEvent',
    #                          marker=VisSet.k_marker_shape_triangle,
    #                          color='blue')

    # Other option overrides
    # vis_set.options['defaultBaseLayer'] = 'ESRI National Geographic'
    vis_set.hide_layer('heatmapVis')

    # Example bindings (NOTE: You may or may not have these sources available.
    # You will have to modify these examples to utilize your available sources.)
    # vis_set.add_binding('nodeVis', 'pointSize',
    #                     'InitialPopulation', 'scale(3, 16)')
    # vis_set.add_binding('nodeVis', 'pointColor',
    #                     'SpatialReport_Prevalence', 'sampleGradient()')
    # vis_set.add_binding('heatmapVis', 'source',
    #                     'SpatialReport_Infectious_Vectors_Count', 'none()')

    # Consistency check
    vis_set.validate()

    # Emit VisSet
    vis_set.write_as('visset.json', k_sim_url_root)

    # Emit URL
    print('When using the standalone Vis-Tools server, use the following URL:')
    visset_path = path.join(k_products_dir, 'visset.json').replace('\\', '/')
    visset_path = visset_path.replace('./', k_sim_url_root)
    print('http://localhost:8000/vistools/geospatial.html?set=%s' % visset_path)

    # Done
    script_end = tm.time()
    print('\nElapsed time %.2f seconds' % float(script_end - script_start))
Run the preprocessing script#
Now, in that same command prompt window, run the newly generated preprocessing script. Use the command:
python Vis-Tools\6bac0b833ebec278e86790150241b834\preprocess_zambia_data.py
Running this command, we get the following output in the command window:
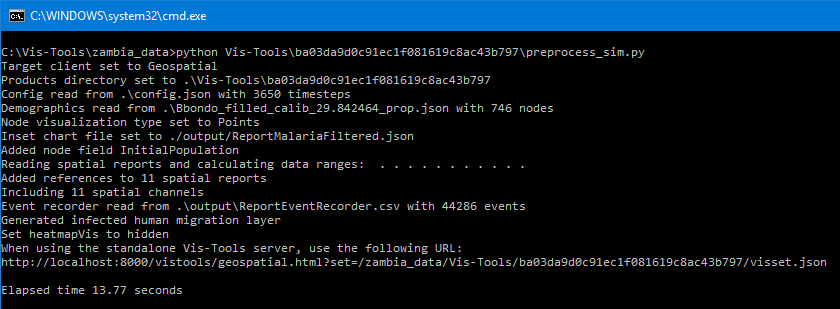
The preprocessing script emits various status information as it processes the simulation’s files, but ultimately emits a new file called a visset, which is located in the same directory as the preprocessing script itself. It also emits the URL we can use to visualize the simulation’s data, which in our example is:
http://localhost:8000/vistools/geospatial.html?set=/zambia_data/Vis-Tools/6bac0b833ebec278e86790150241b834/visset.json
Copy that URL for the next step.
Run the Geospatial visualization client#
If you don’t already have the local web server running, run it now by double-clicking the server.bat file in the Vis-Tools directory.
Once you have a browser window up, paste in the URL from the preprocessing run’s output. In the case of our example, we see the following:
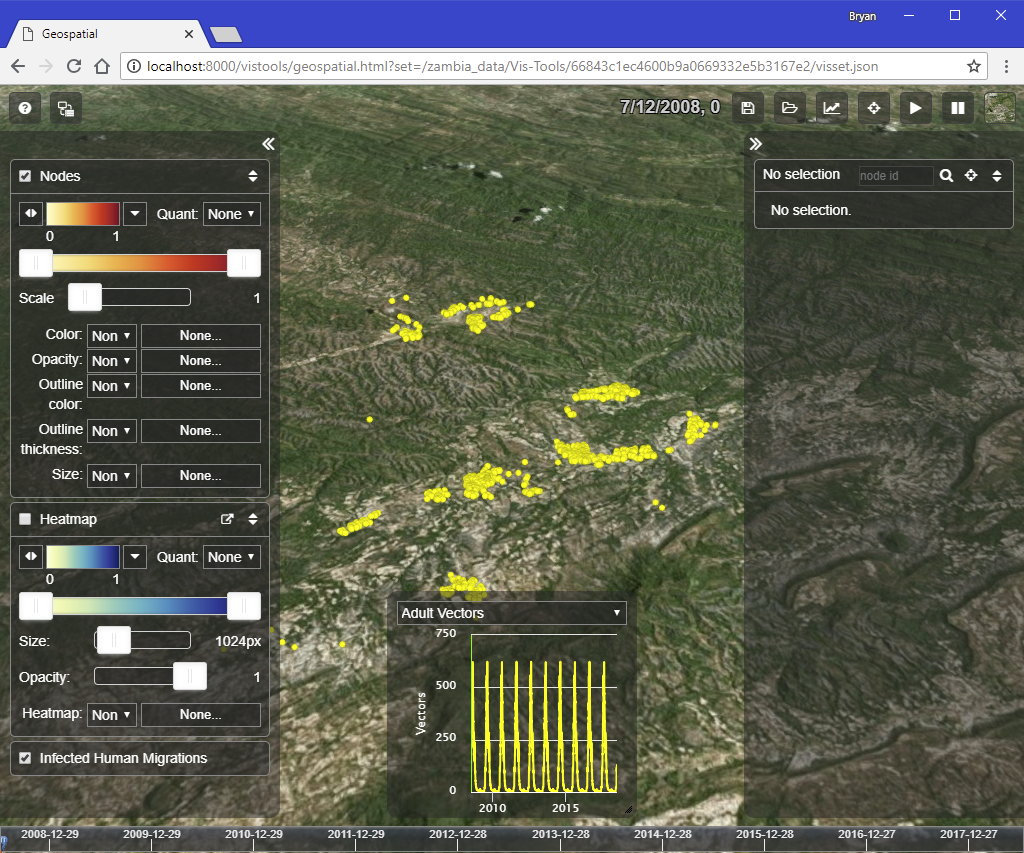
The preprocessing script created a visset that lets us see our nodes on the map, with no bindings between our simulation’s outputs and the visual parameters of the visualization at all. It’s a good starting point for us to customize the visualization to our needs.
To learn more about the Geospatial visualization client, see Geospatial.