Interface overview#
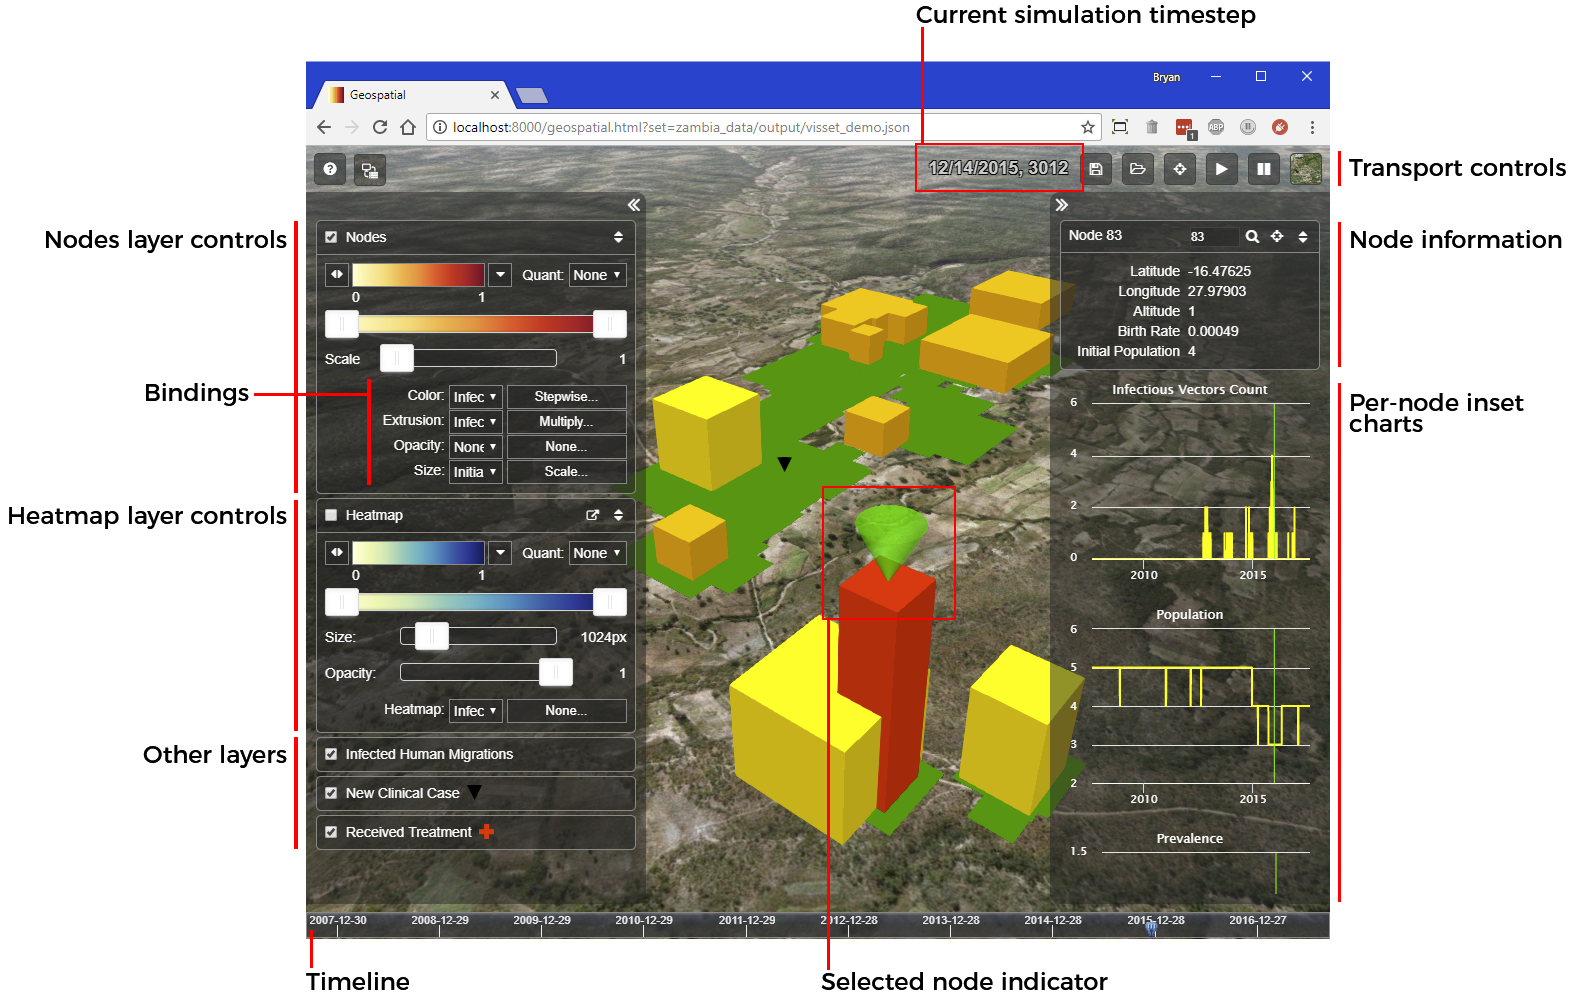
This topic describes the user interface elements in the Vis-Tools Geospatial client. The Geospatial client provides both data visualization and a user interface for manipulating various aspects of the visual presentation. It is built for both experimentation and presentation. Here’s an overview of the window’s parts:
Note
The figure above shows a visset that uses the shapes node representation. Some aspects of the window will differ for vissets that use “points” representation, which are noted later. For more information about the two node representations, see Points versus shapes.
Note
You can make the browser window any size you like, including full screen for presentation purposes. Note that the bigger the window, the harder that your computer’s GPU will have to work to render animation frames, so you may see a degradation in animation performance for large windows. You can also make the window smaller to make room for other windows on your computer, but below 1024 x 768, some user interface elements may start to overlap.
Manipulating the globe#
The Geospatial client is built atop the excellent open-source Cesium global mapping package, and follows the conventions set forth by that package for manipulation of the globe itself.
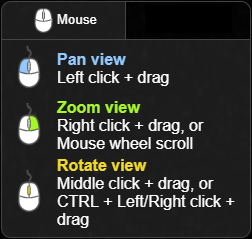
The Geospatial client will automatically fly to your simulation’s nodes when it is first launched, but you will likely find yourself moving around the map using these mouse gestures.
Top-row controls and message area#
The top of the window contains some fundamental sections.

The Message area shows informational and error messages. The Date & timestep area shows the date and timestep number of the current location in the timeline. (The timeline itself is not shown in the figure. It is located at the bottom of the Geospatial client window. See Timeline.)
Note
The timestep-to-date mapping is under the control of your preprocessing
script. Preprocessing scripts generated by survey will by default choose
a simulation start date such that the simulations ends at the date the
preprocessing script itself is run. To override this behavior, you can set
the start date in the visset by adding a line to your preprocessing script:
vis_set.set_start_date("2014-09-30")
To the right of those areas are some buttons with the following functions:
Button |
Description |
|---|---|

|
Help. This button shows the built-in help dialog box with a subset of the information in this documentation. |

|
COMPS. This button, which is only present if the simulation has a COMPS sim ID, returns to the COMPS explore view for the present simulation. |

|
Save. This button saves the current visualization settings for the Geospatial client to a file on your local computer. |

|
Load. This button lets you reload a set of visualization settings you previously saved with the Save button. |

|
Aggregate inset charts. This button, which is only present if an inset chart file is specified in the preprocessing script, toggles the visibility of the aggregate inset chart panel. See Aggregate inset charts. |

|
Recenter. This button causes the Geospatial client to recenter the view onto the bounding box of your nodes, looking straight down. |


|
Play/Pause. This button starts/stops animation playback of the simulation’s data. How fast the playback advances depends critically on the number of nodes, timesteps, and layers being displayed. |
|
|
Pause. This button pauses playback of the simulation animation. |

|
Base map. This button, which is part of the underlying Cesium mapping package, allows you to choose a base map layer from a list of available base maps, some of which are satellite-based, and others cartographic. |
Note
The base map menu is provided by the underlying Cesium mapping library. Along with setting the base map layer, the menu also provides the ability to display 3D terrain, which is turned off by default. While you can enable terrain in the Geospatial client, most of the visualization will become invisible, because it will be at 0 meters altitude, and thus rendered beneath the terrain. Therefore you should generally stick to the “WGS Ellipsoid” terrain map, which is a plain ellipsoid approximation of the Earth.
Timeline#
At the very bottom of the window is the Timeline.

The timeline is a part of the Cesium mapping package. The blue Current time indicator shows the current date in the simulation, and the range of dates in the data. You can drag the indicator with the mouse to “scrub” time, updating the visualization as you drag.
Side panels#
The window has two retractable panels on the left and right. Both panels share some common elements, as shown here.
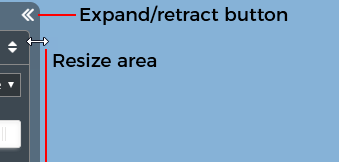
The Expand/retract button lets you show or hide the panel with a single click. When the panel is expanded, you can also resize it by dragging the inside edge.
Left panel#
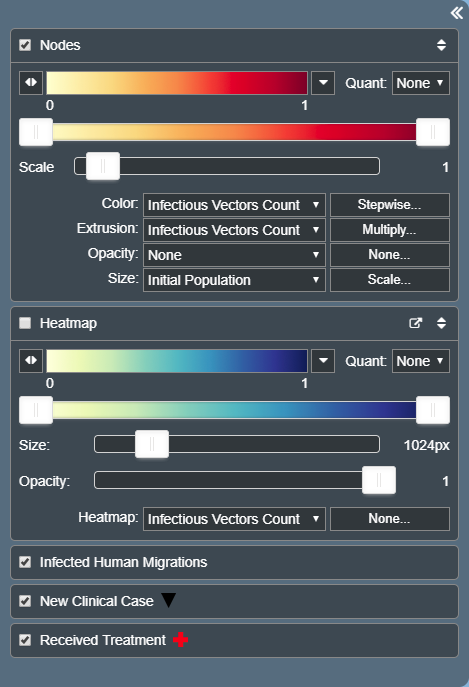
The left panel contains controls for showing and hiding the various layers that have been created in the preprocessing step, and controlling their appearance. The exact set of elements in this panel varies depending on the simulation and preprocessing script.
The controls for each layer type are described in detail below. See Layer controls.
Right panel#
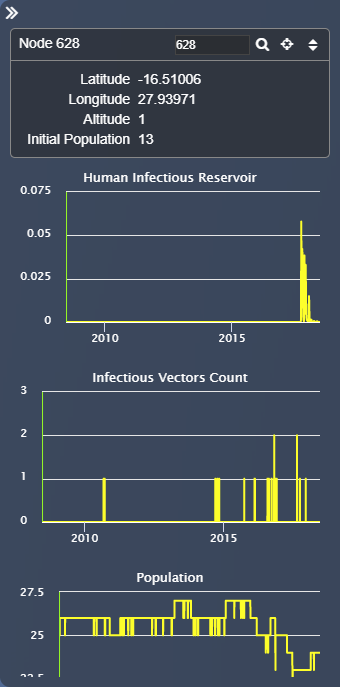
The right panel contains the per-node inset charts, node information, and node search area. The inset charts and node information are only available when a node is selected (by clicking on the node on the map).
To search for a particular node, type the node ID into the search box and click the magnifier search button. The node’s information and charts will be shown, and the view will pan to center the found node.
Aggregate inset charts#
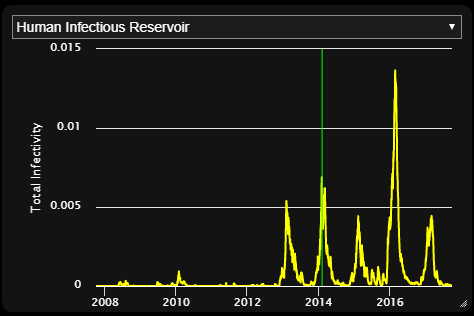
If an inset chart file is specified in the preprocessing script (see Inset chart), the inset panel and toggle button will be available. This panel shows any one of the aggregate channels from the simulation’s output. To change the channel, use the channel select control at the top of the window.
Per-node inset charts#
The right panel in the Vis-Tools Geospatial client shows information and inset charts for the selected node.
To select a node, click on its node point or shape. To deselect, click anywhere on the map where there is no node.
When a node is selected, a selection indicator will appear on it. The appearance of the selection indicator is different for points and shapes nodes.
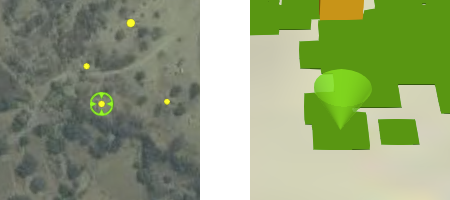
Selected point node (left), and shape node (right)#
The number and content of per-node inset charts depends on the spatial reports in the associated visset. The panel will scroll if necessary.
The green line in the chart indicates the current timestep. To seek the visualization to a different timestep, you can click directly in any graph.
Note
The color of the chart traces and the current-time bar can be customized in the Vis-Tools preprocessing step.
Keyboard shortcuts#
The Vis-Tools Geospatial client has some keyboard shortcuts that can be useful when experimenting with settings or during presentation. For elements with a tooltip (such as buttons), the keyboard shortcut is shown in the tooltip.
Key |
Function |
|---|---|
? |
Toggle the built-in help panel. |
E |
Toggle the right panel open/closed. |
F |
Toggle flat (equirectangular) map projection. |
I |
Toggle the aggregate inset chart panel (if present) open/closed. |
L |
Equivalent to clicking the Load settings button. |
P |
Toggle presentation mode - show/hide all onscreen controls. |
R |
Recenter the map onto the nodes bounding box. |
S |
Equivalent to clicking the Save settings button. |
W |
Toggle the left panel open/closed. |
1 - 9 |
Toggle the visibility of layers. “1” toggles Nodes, “2” toggles Heatmap, and subsequent numbers toggle whatever animation layers are present in the order they appear. |
Space |
Play/pause timeline animation. |
Home |
Seek time bar to beginning of simulation. |
End |
Seek time bar to end of simulation. |
Left arrow |
Step backward in time (4 hours by default). |
Shift-left |
Step backward in time by one full timestep. |
Right arrow |
Step forward in time (by four hours by default). |
Shift-right |
Step forward in time by one full timestep. |
Note
The amount of time by which the arrow keys advance/retard time can be set during the Vis-Tools preprocessing step.